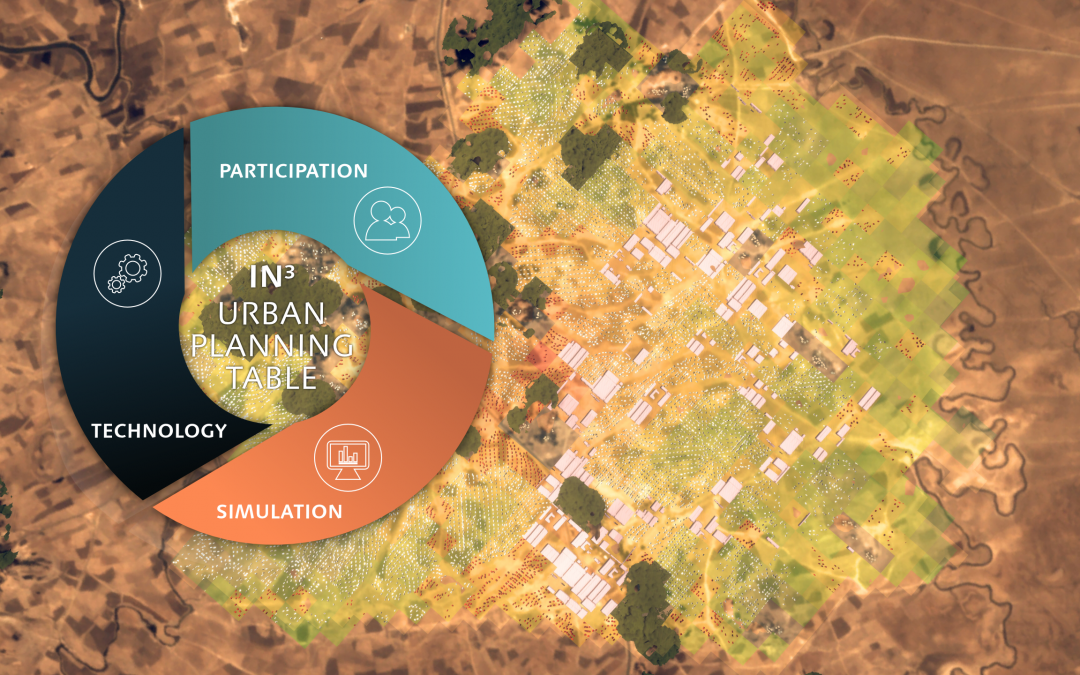
Urban Planning Table – Integrated Infrastructure
Video with impressions of the urban planning table, a walkthrough and created plans of all participants.
Introduction
Many different urban stakeholders such as authorities, planners, investors or local residents are involved in urban planning processes. Coordination and communication between the parties involved is often difficult, especially since not all parties have the same level of knowledge. This is particularly problematic when plans are not understood by those affected by the planning decisions.

The Ethiopian Ambassador in Germany (right) listens to our explanation of the project.
As part of the research project “Integrated Infrastructure – IN3”, we want to support planning participants in developing Ethiopian villages into towns in tow ways. First, we create and discuss digital tools with the participants to enable fast urban planning. Second, we experiment with explanatory communication tools to provide village residents and local authorities with easy-to-use and game-like access to planning to enable conscious, participatory decision-making.
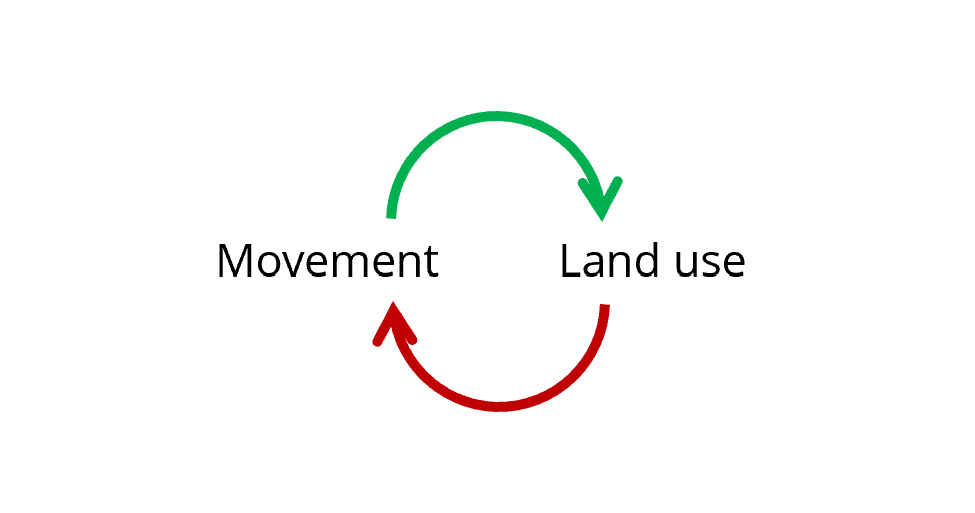
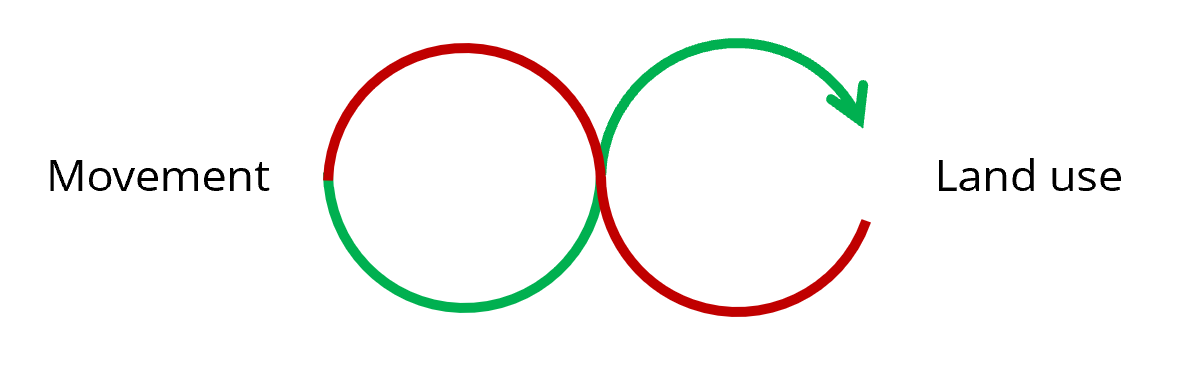
In a discussion with village representatives, we gained valuable insights using a prototypical communication tool. We drew attention to drastic changes in the village environment during a growth process from previous population of approx. 1,000 to the expected 10,000 inhabitants. This highlighted, for example, how land use and water infrastructure would be affected.
For the exhibition “ሠላም Bauhaus” (Selam Bauhaus), we designed a simplified version that should give the users access to planning aspects in a fictious Ethiopian context without further help. The generated planning scenarios surely do not represent the final plans. We hope, however, that this type of interaction will stimulate discussion and reflection on new possibilities for planning and participation.
User Experience
Being confronted with the complexities of planning and the multitude of challenges that arise, a user would be overwhelmed by the amount of information. Although the exhibited urban planning table simplifies planning relevant issues to estimatable and visualisable results, a direct confrontation with all parameters would lead to a visual clutter. Therefore, planning issues and population growth are introduced step by step with assisting information and contextutual visualisations:
1. Placement of city and setting its density – The city is small with a population of 1.000 inhabitants. The user has time to get used to the navigation and can move around the city through interaction with its icon.
2. Prioritising areas for agriculture or forest – The city grows to 3.000 inhabitants. A slider is introduced to weight the importance of nature against jobs in food production. The user can explore the difference not only on the map but also through performance evaluation.
3. Loss of agriculture demands new employment – The city has a population of 6.000 inhabitants. A new icon for industry is introduced. Moving it around affects air quality. Through two new sliders jobs in commercial or industrial sector can be created. It affects directly the land use plan of the city.
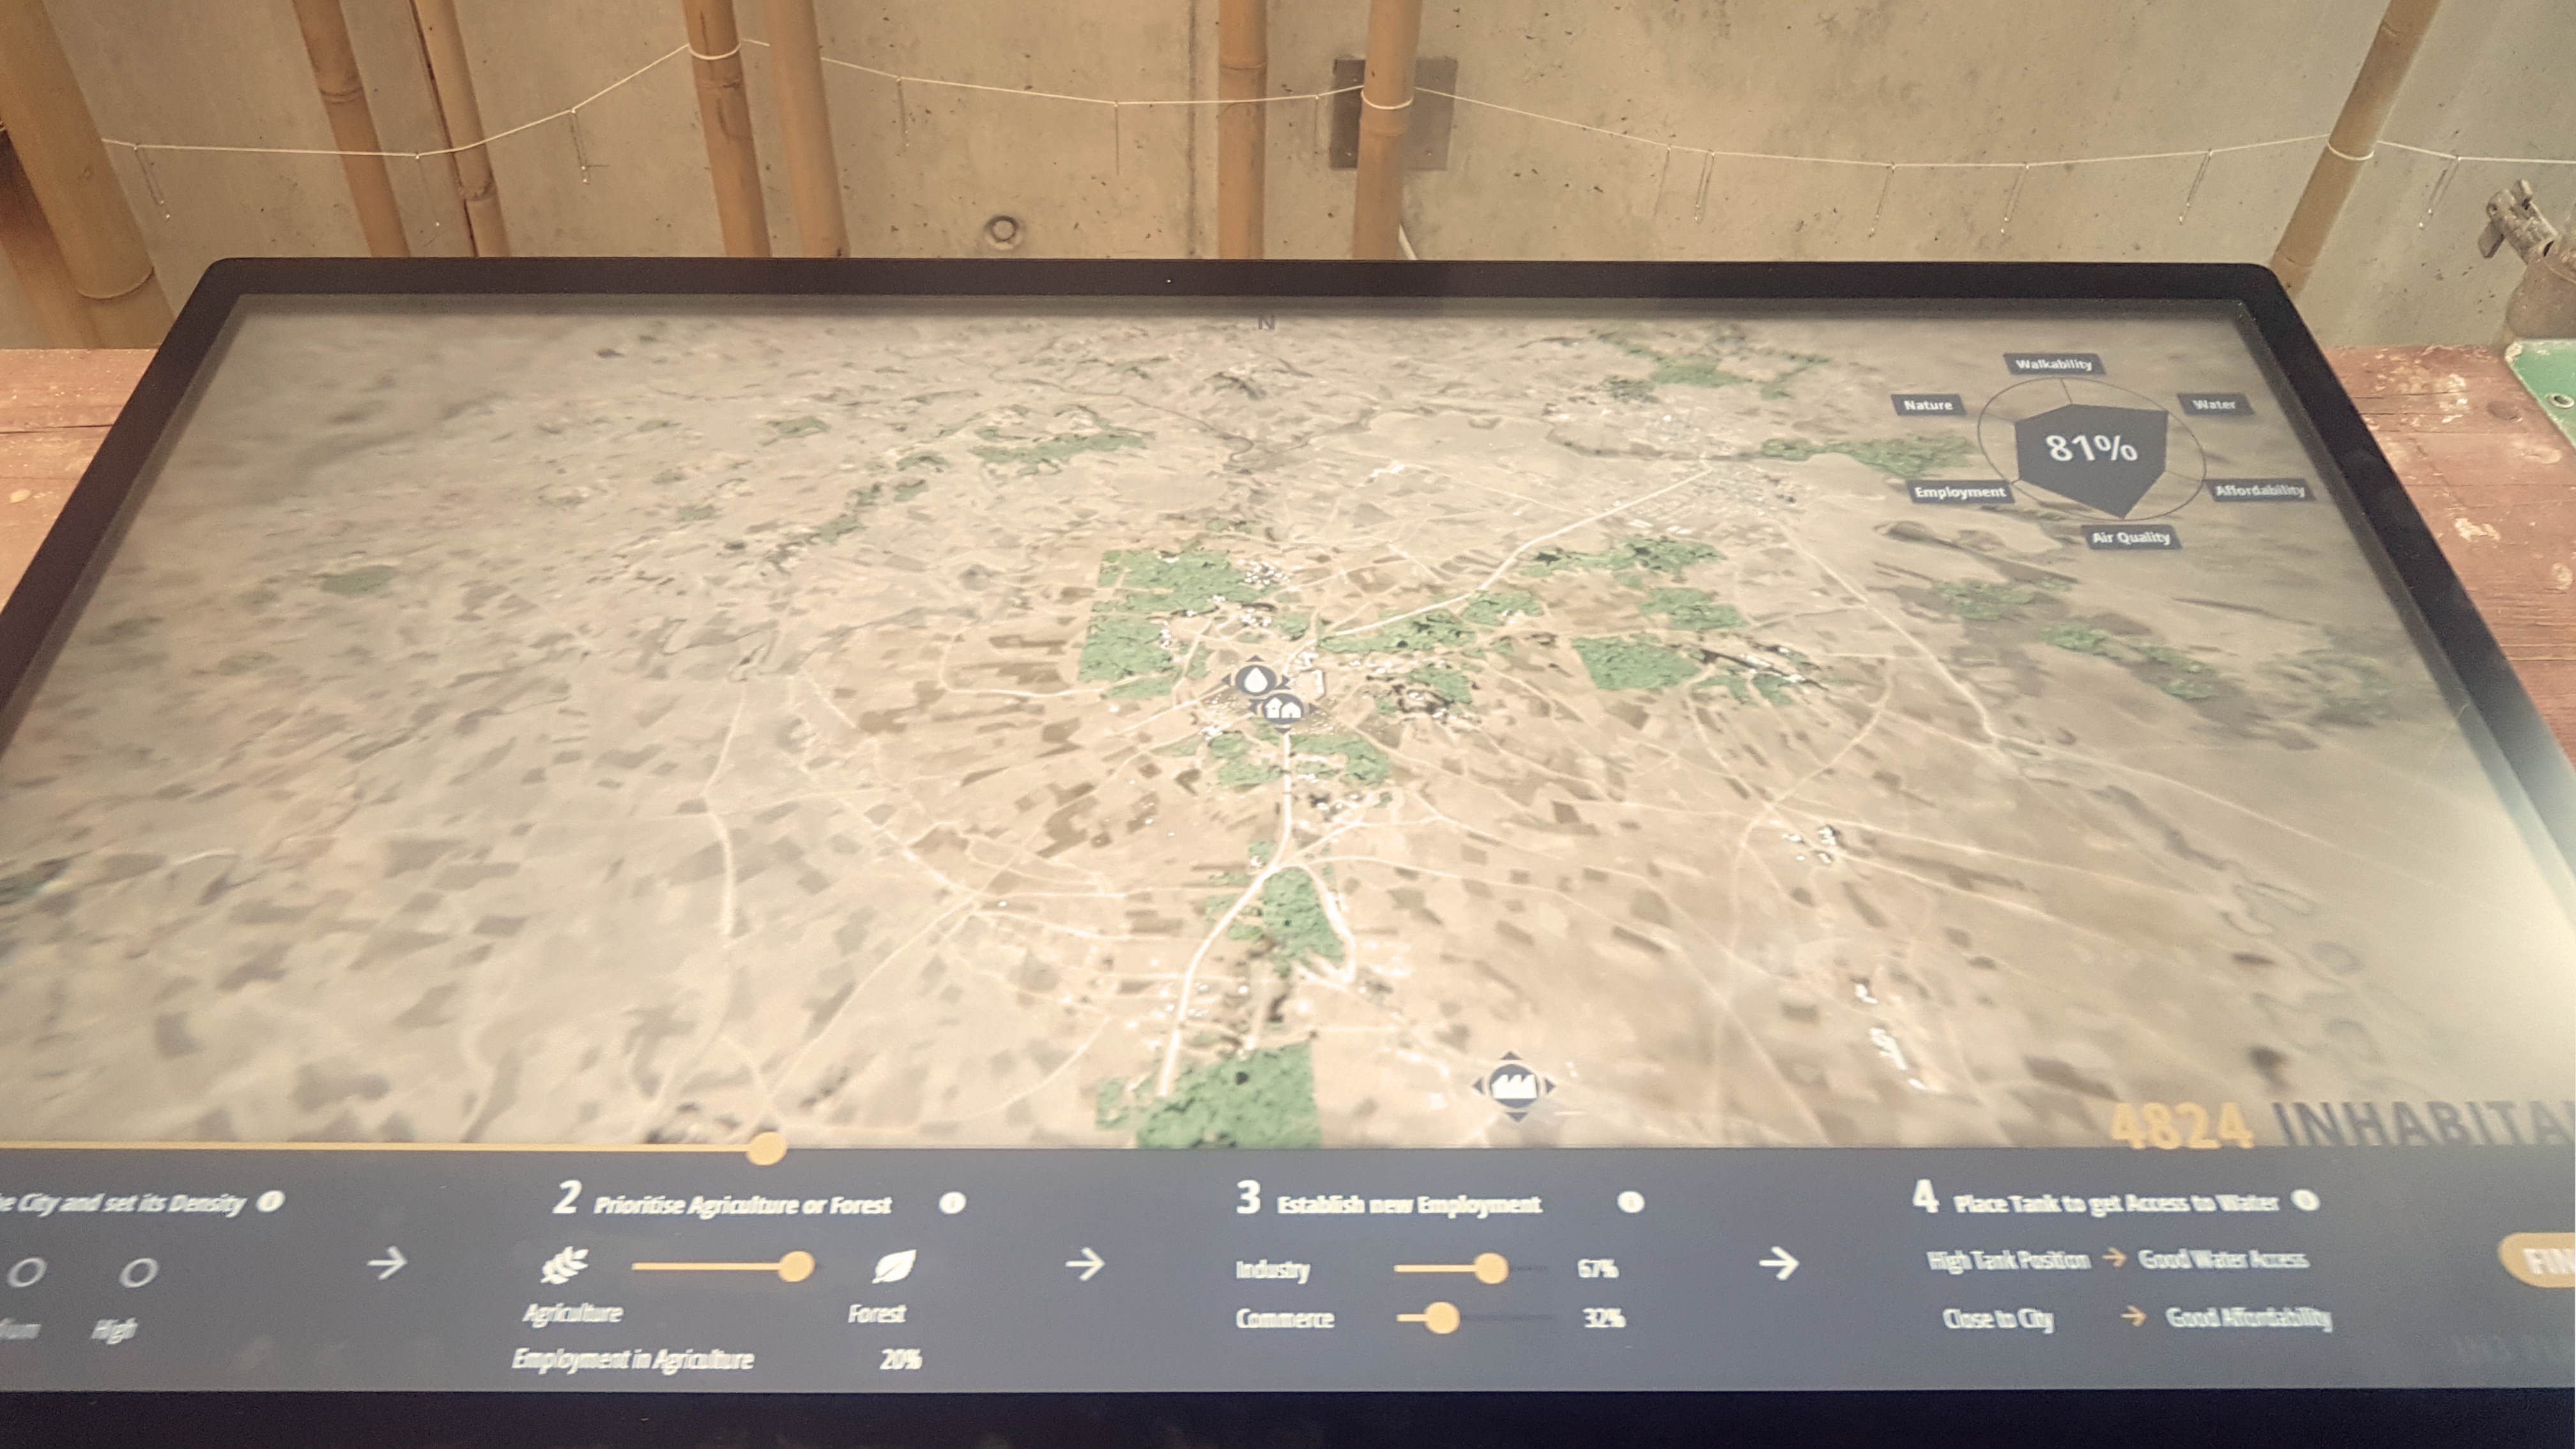
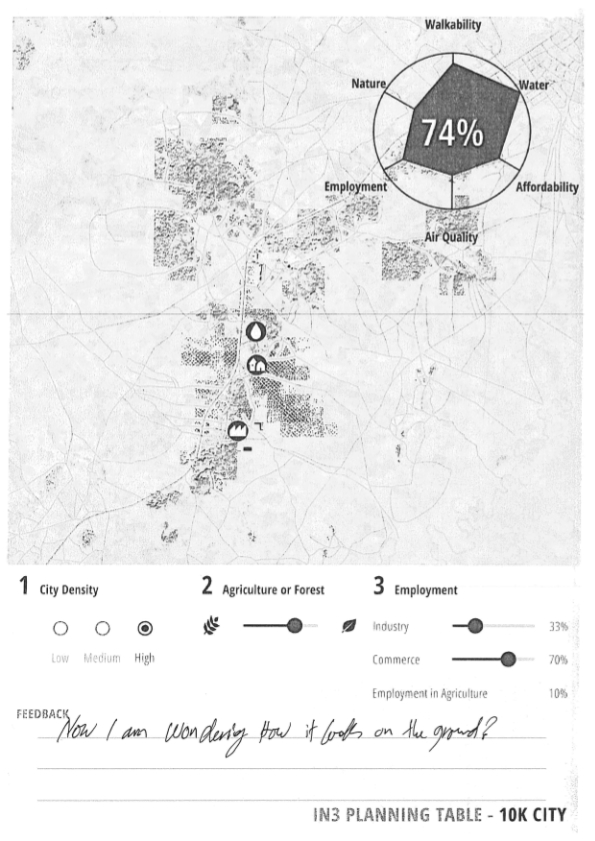
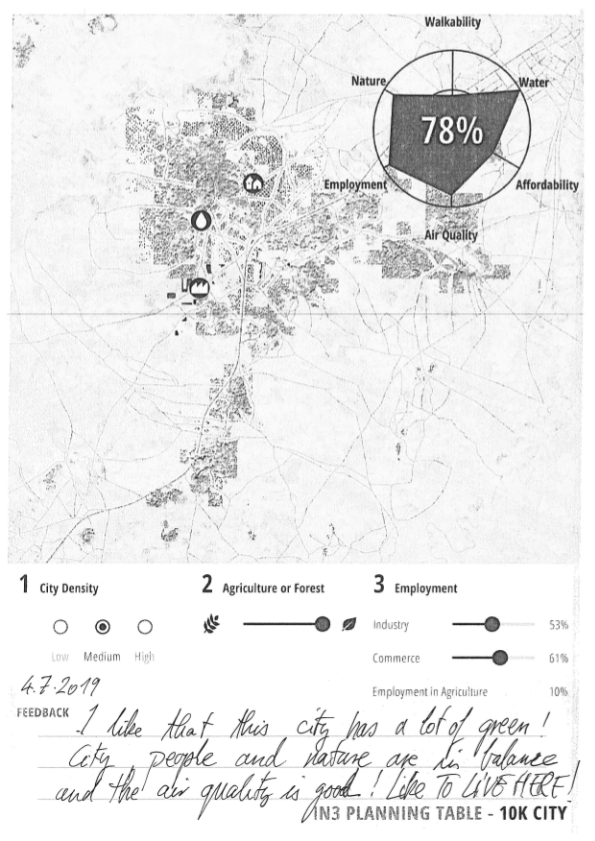
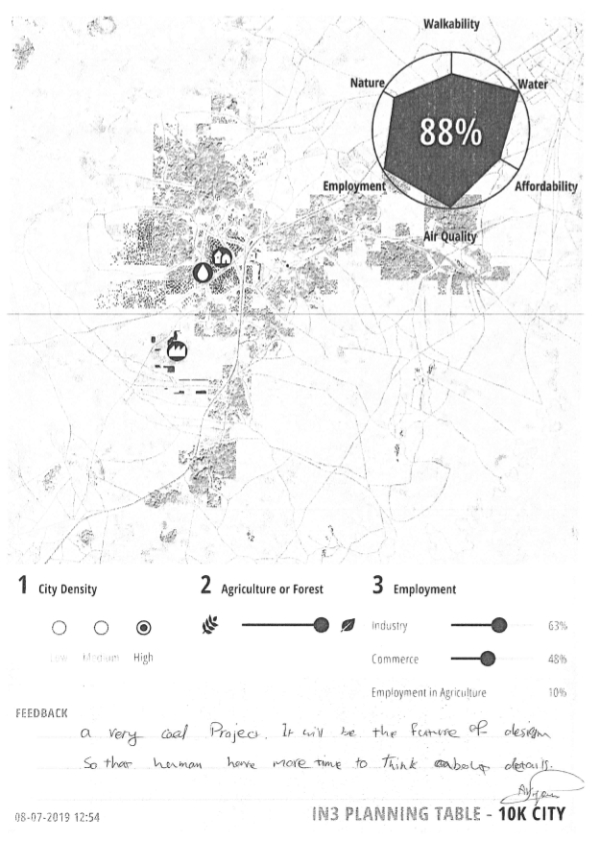
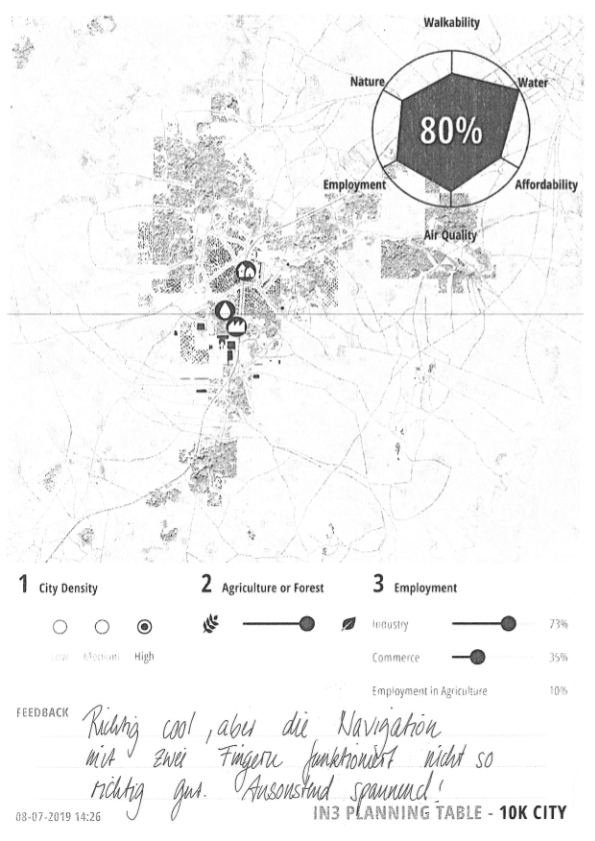
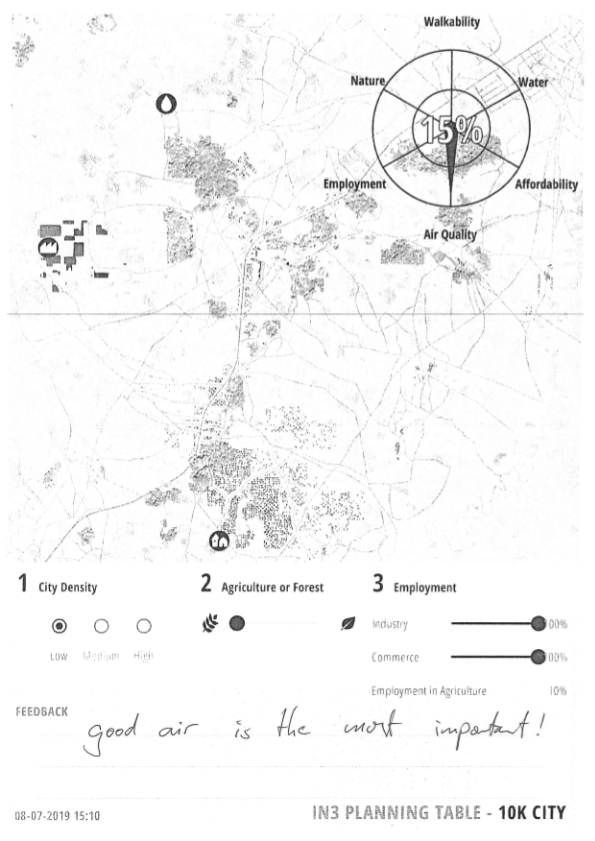
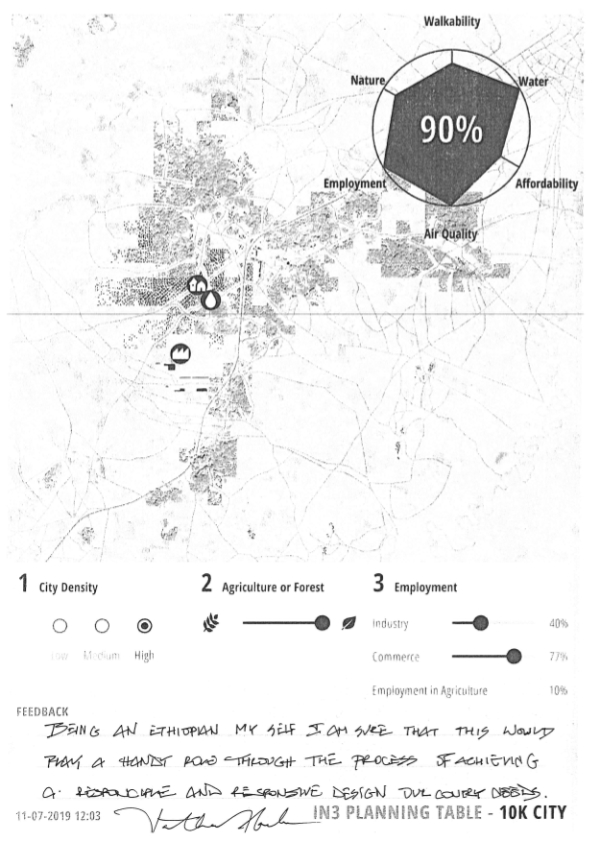
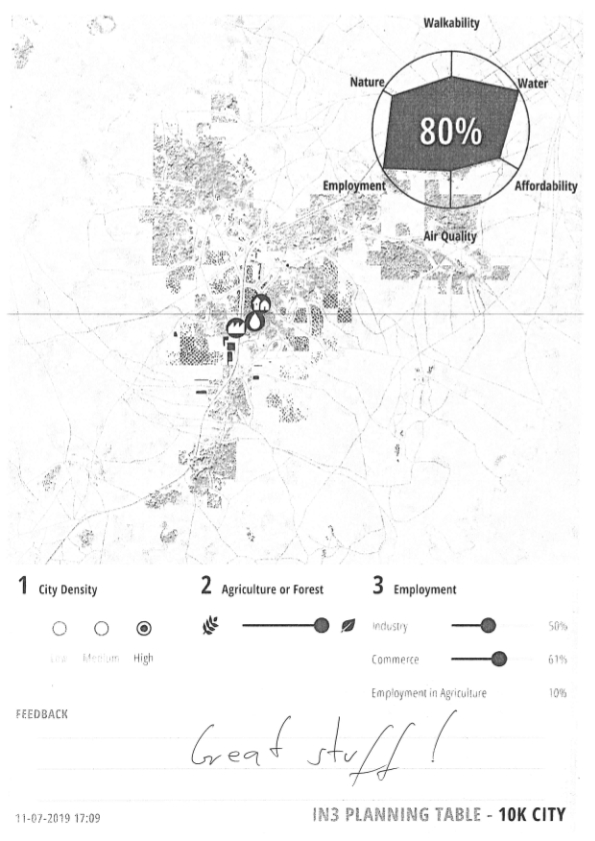
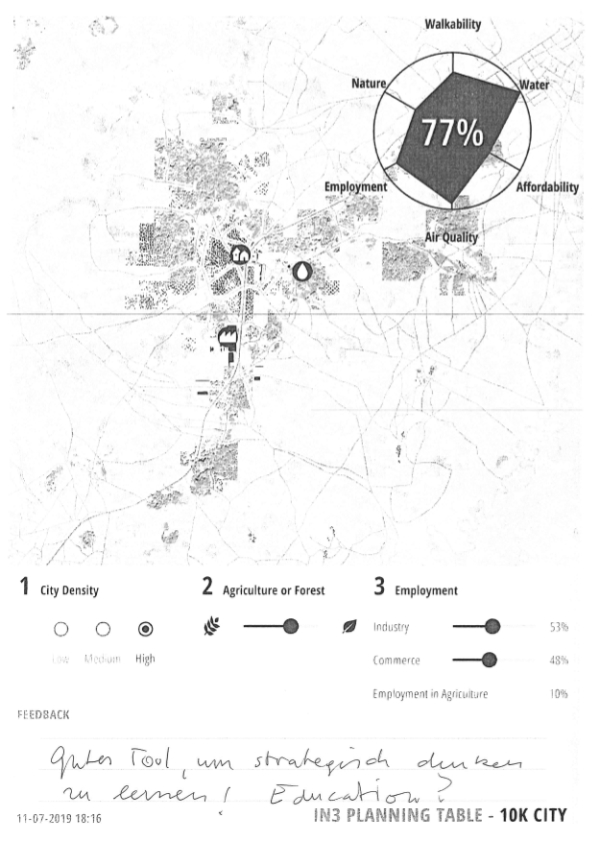
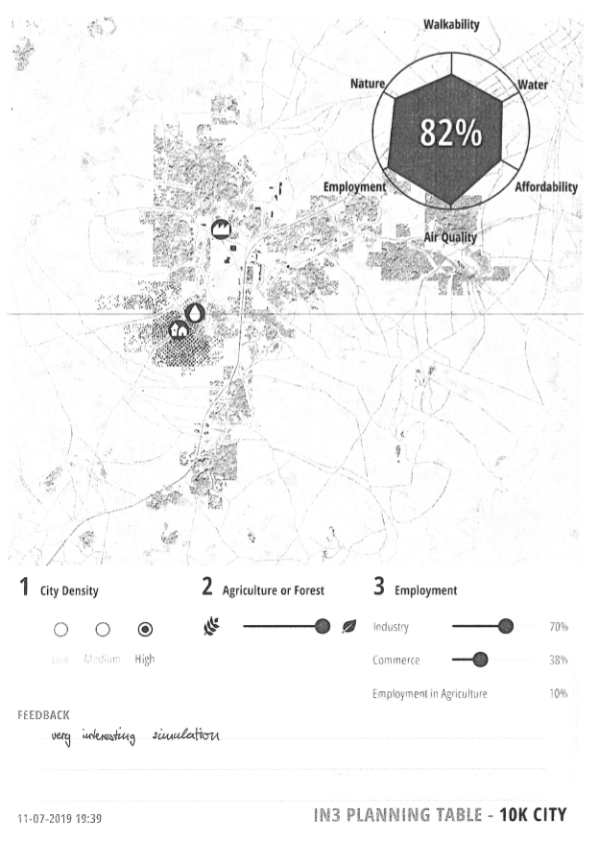
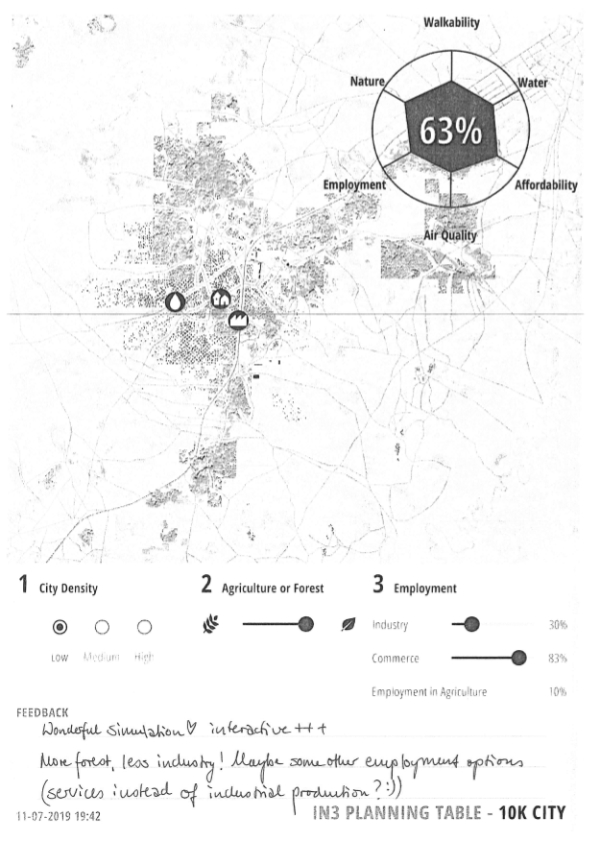
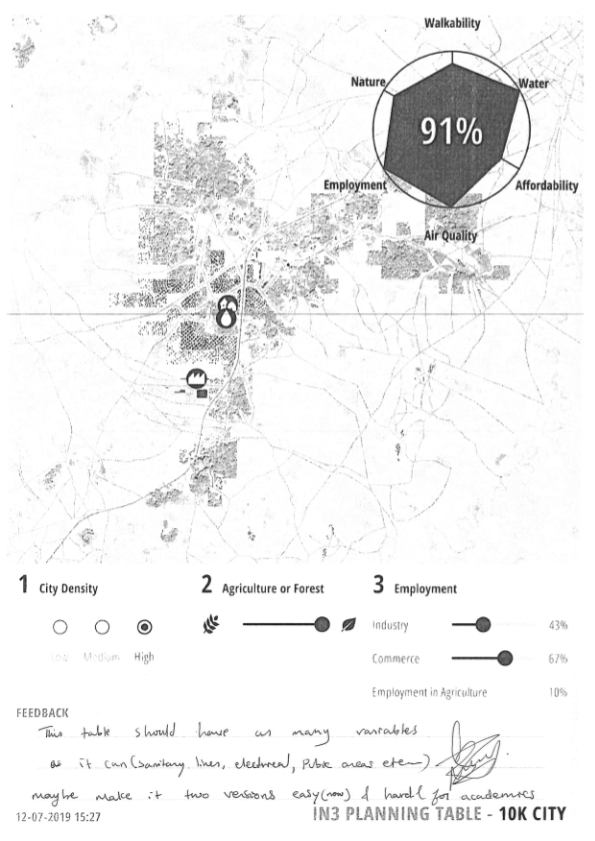
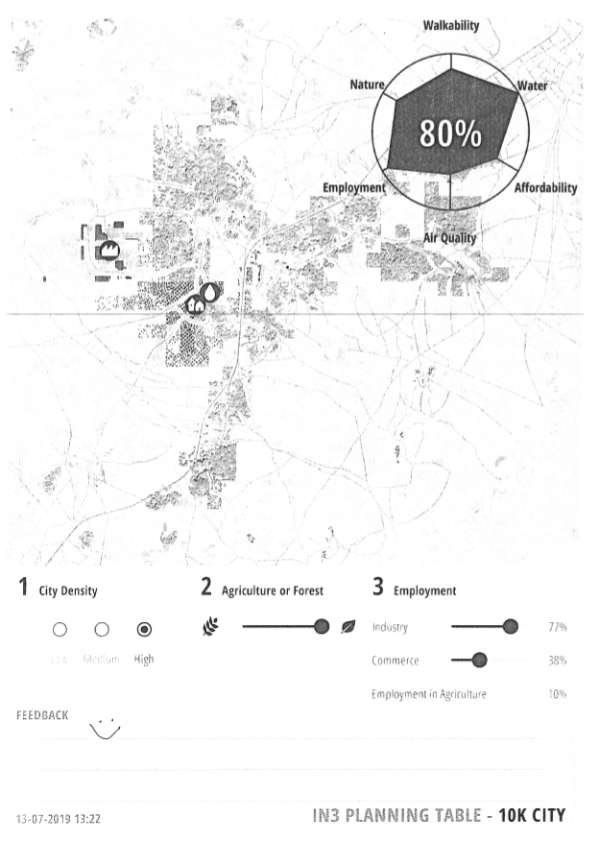
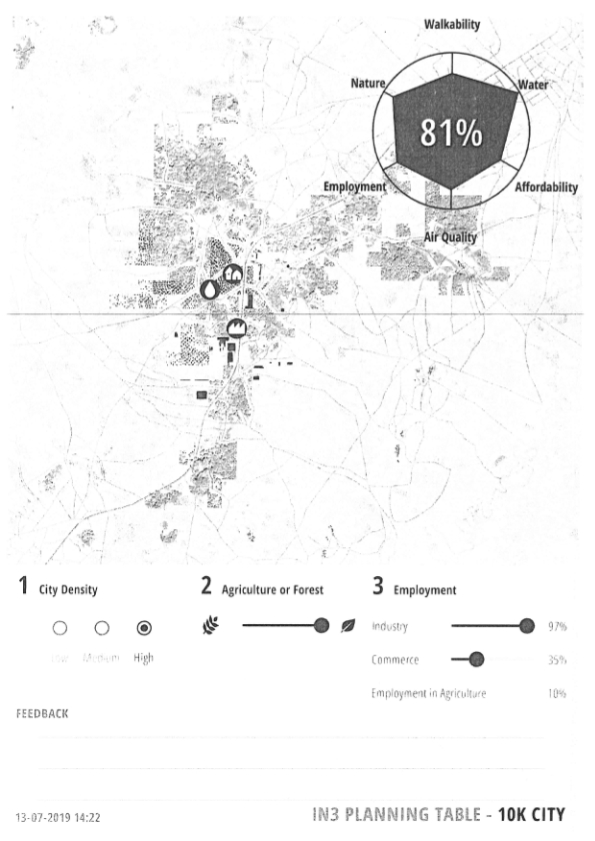
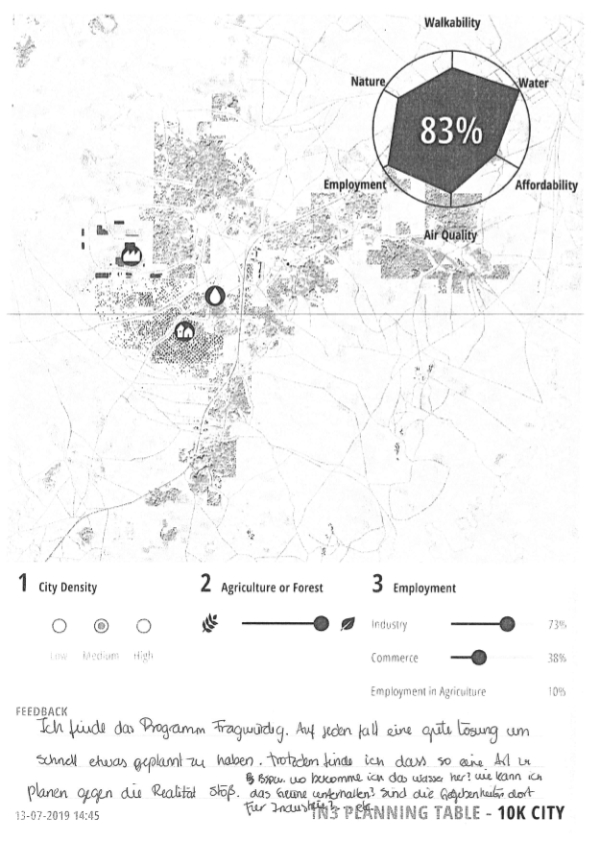
Exhibited Planning Table with an interactive map, the four planning steps on the bottom and performance evaluation on the upper right.
4. Satisfying water demand – The city reaches a population of 10.000 inhabitants. A water drop icons is now available and sets the location of a water tank. To reach water supply for every household the water pressure needs to be high enough and therefore the water tank should be placed on high altitude.
Finish. Based on the four steps, the user can simulate the population growth through usage of a slider. Within the exhibition, the final plan has been print out for the user by the tool.
The interaction with the planning table happens through intuitive touch commands and the user is continously informed on the feasability of the chosen city layout through real-time performance evaluation.
Rotate Camera

Camera Zoom

Move Camera

Move Objects
Performance Evaluation
Performance Evaluation
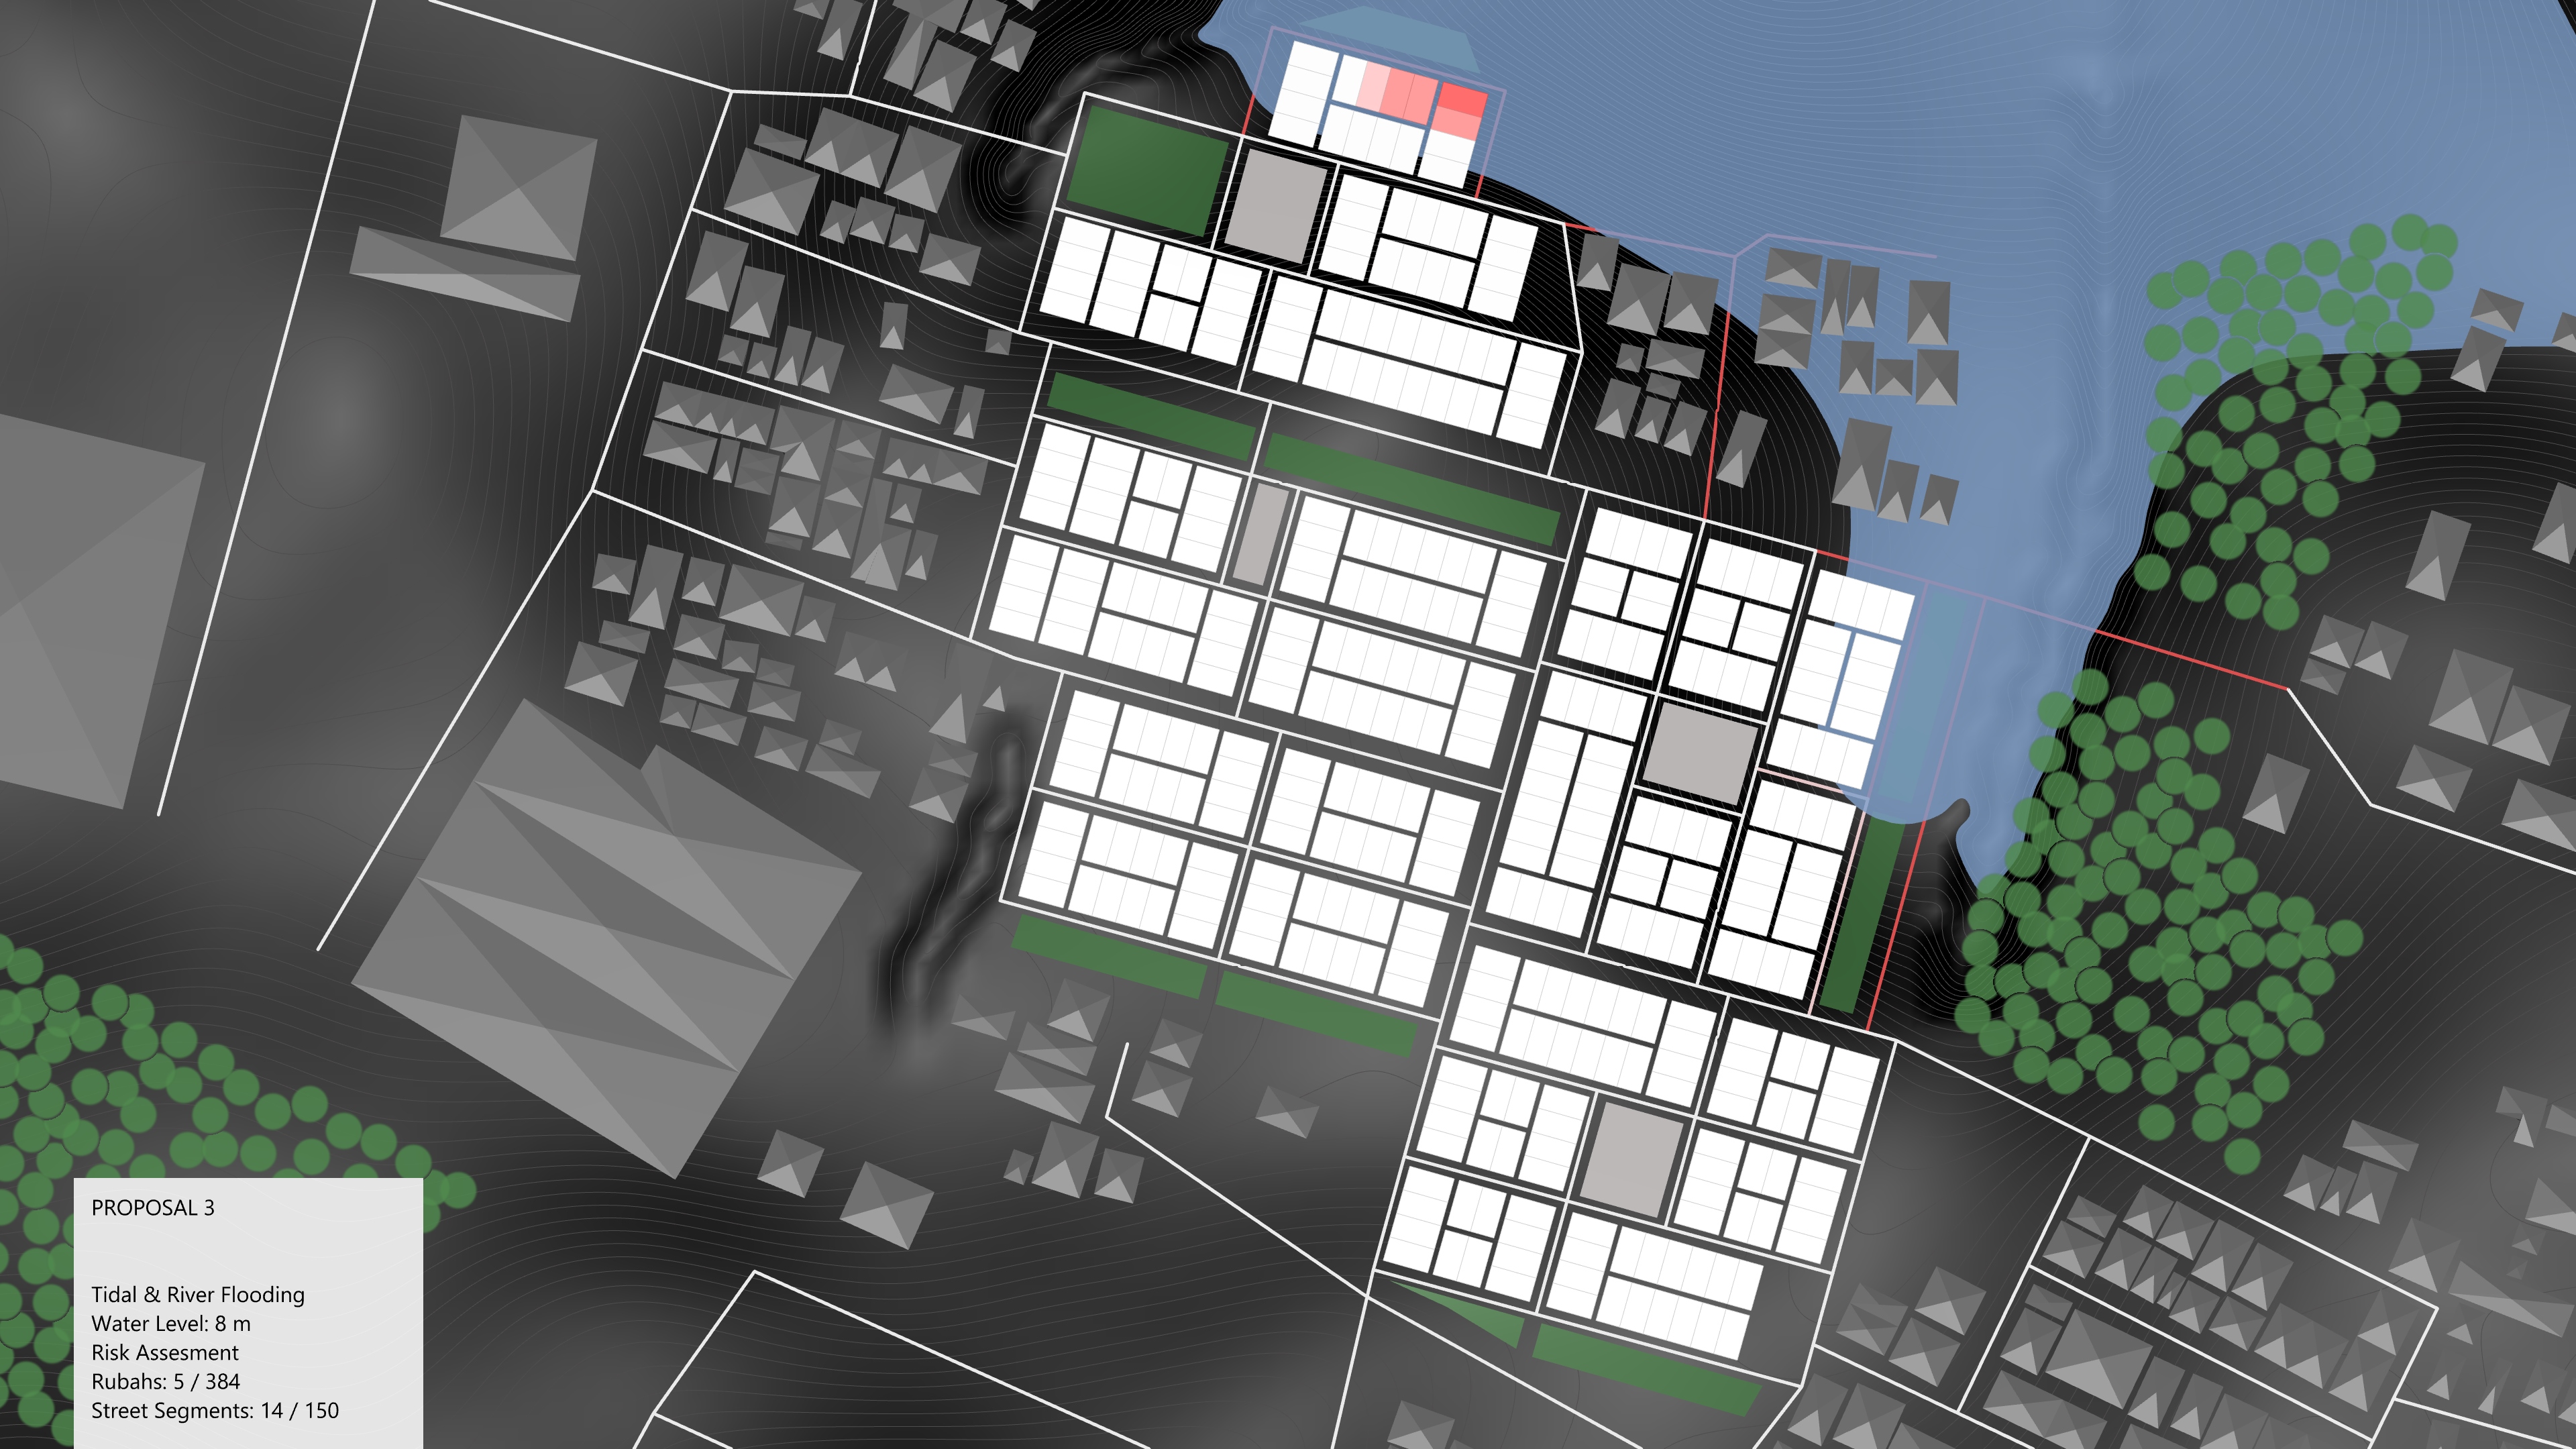
The urban planning table evaluates certain factors such as walkability, water demand, infrastructure affordability, air quality, employment and connection to nature to give continous feedback on planning relevant issues. The planning table users will realise that the factors are interrelated and a benefit for one criteria will challenge another. Therefore, the users will have to weight and compromise on their own demands. The criteria are explained in more detailled:
Walkability
In a city of short distances, the most important facilities can be reached quickly. The closer people live to each other, the easier it is to meet on foot. A round city would be ideal, but there are other factors that belong to a good city. So is it worth losing a bit of walkability for other qualities?
Nature
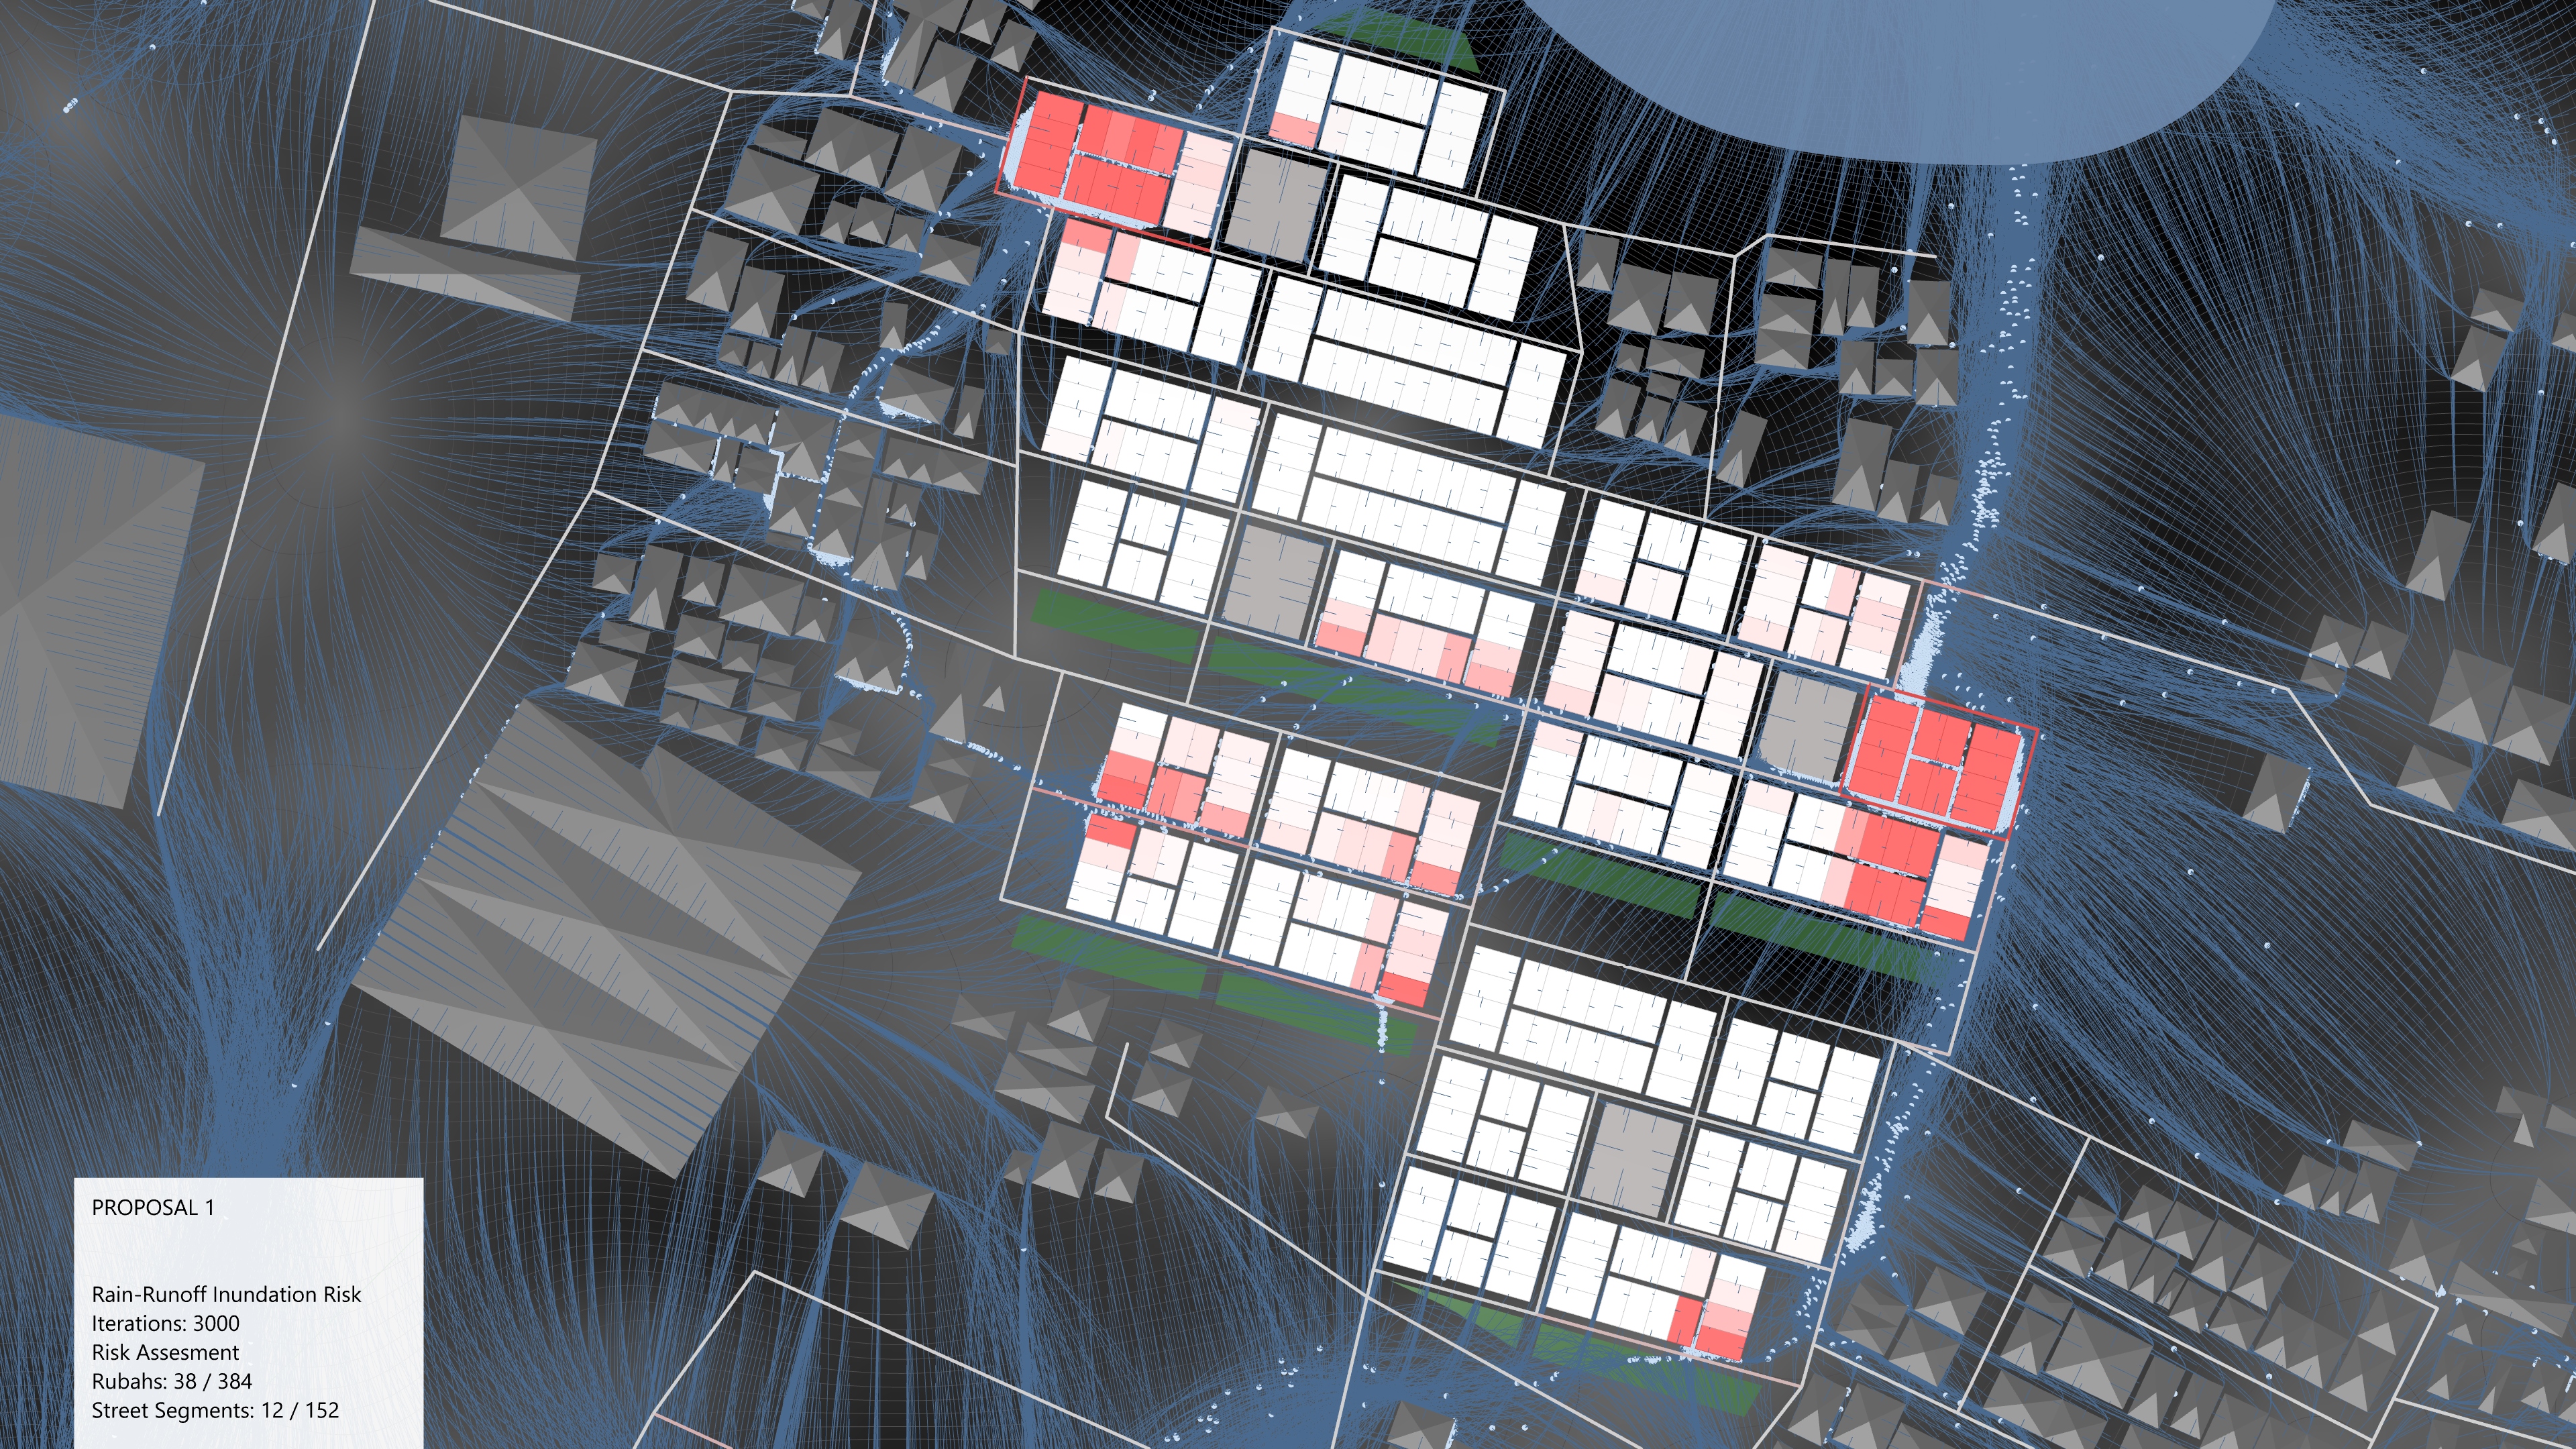
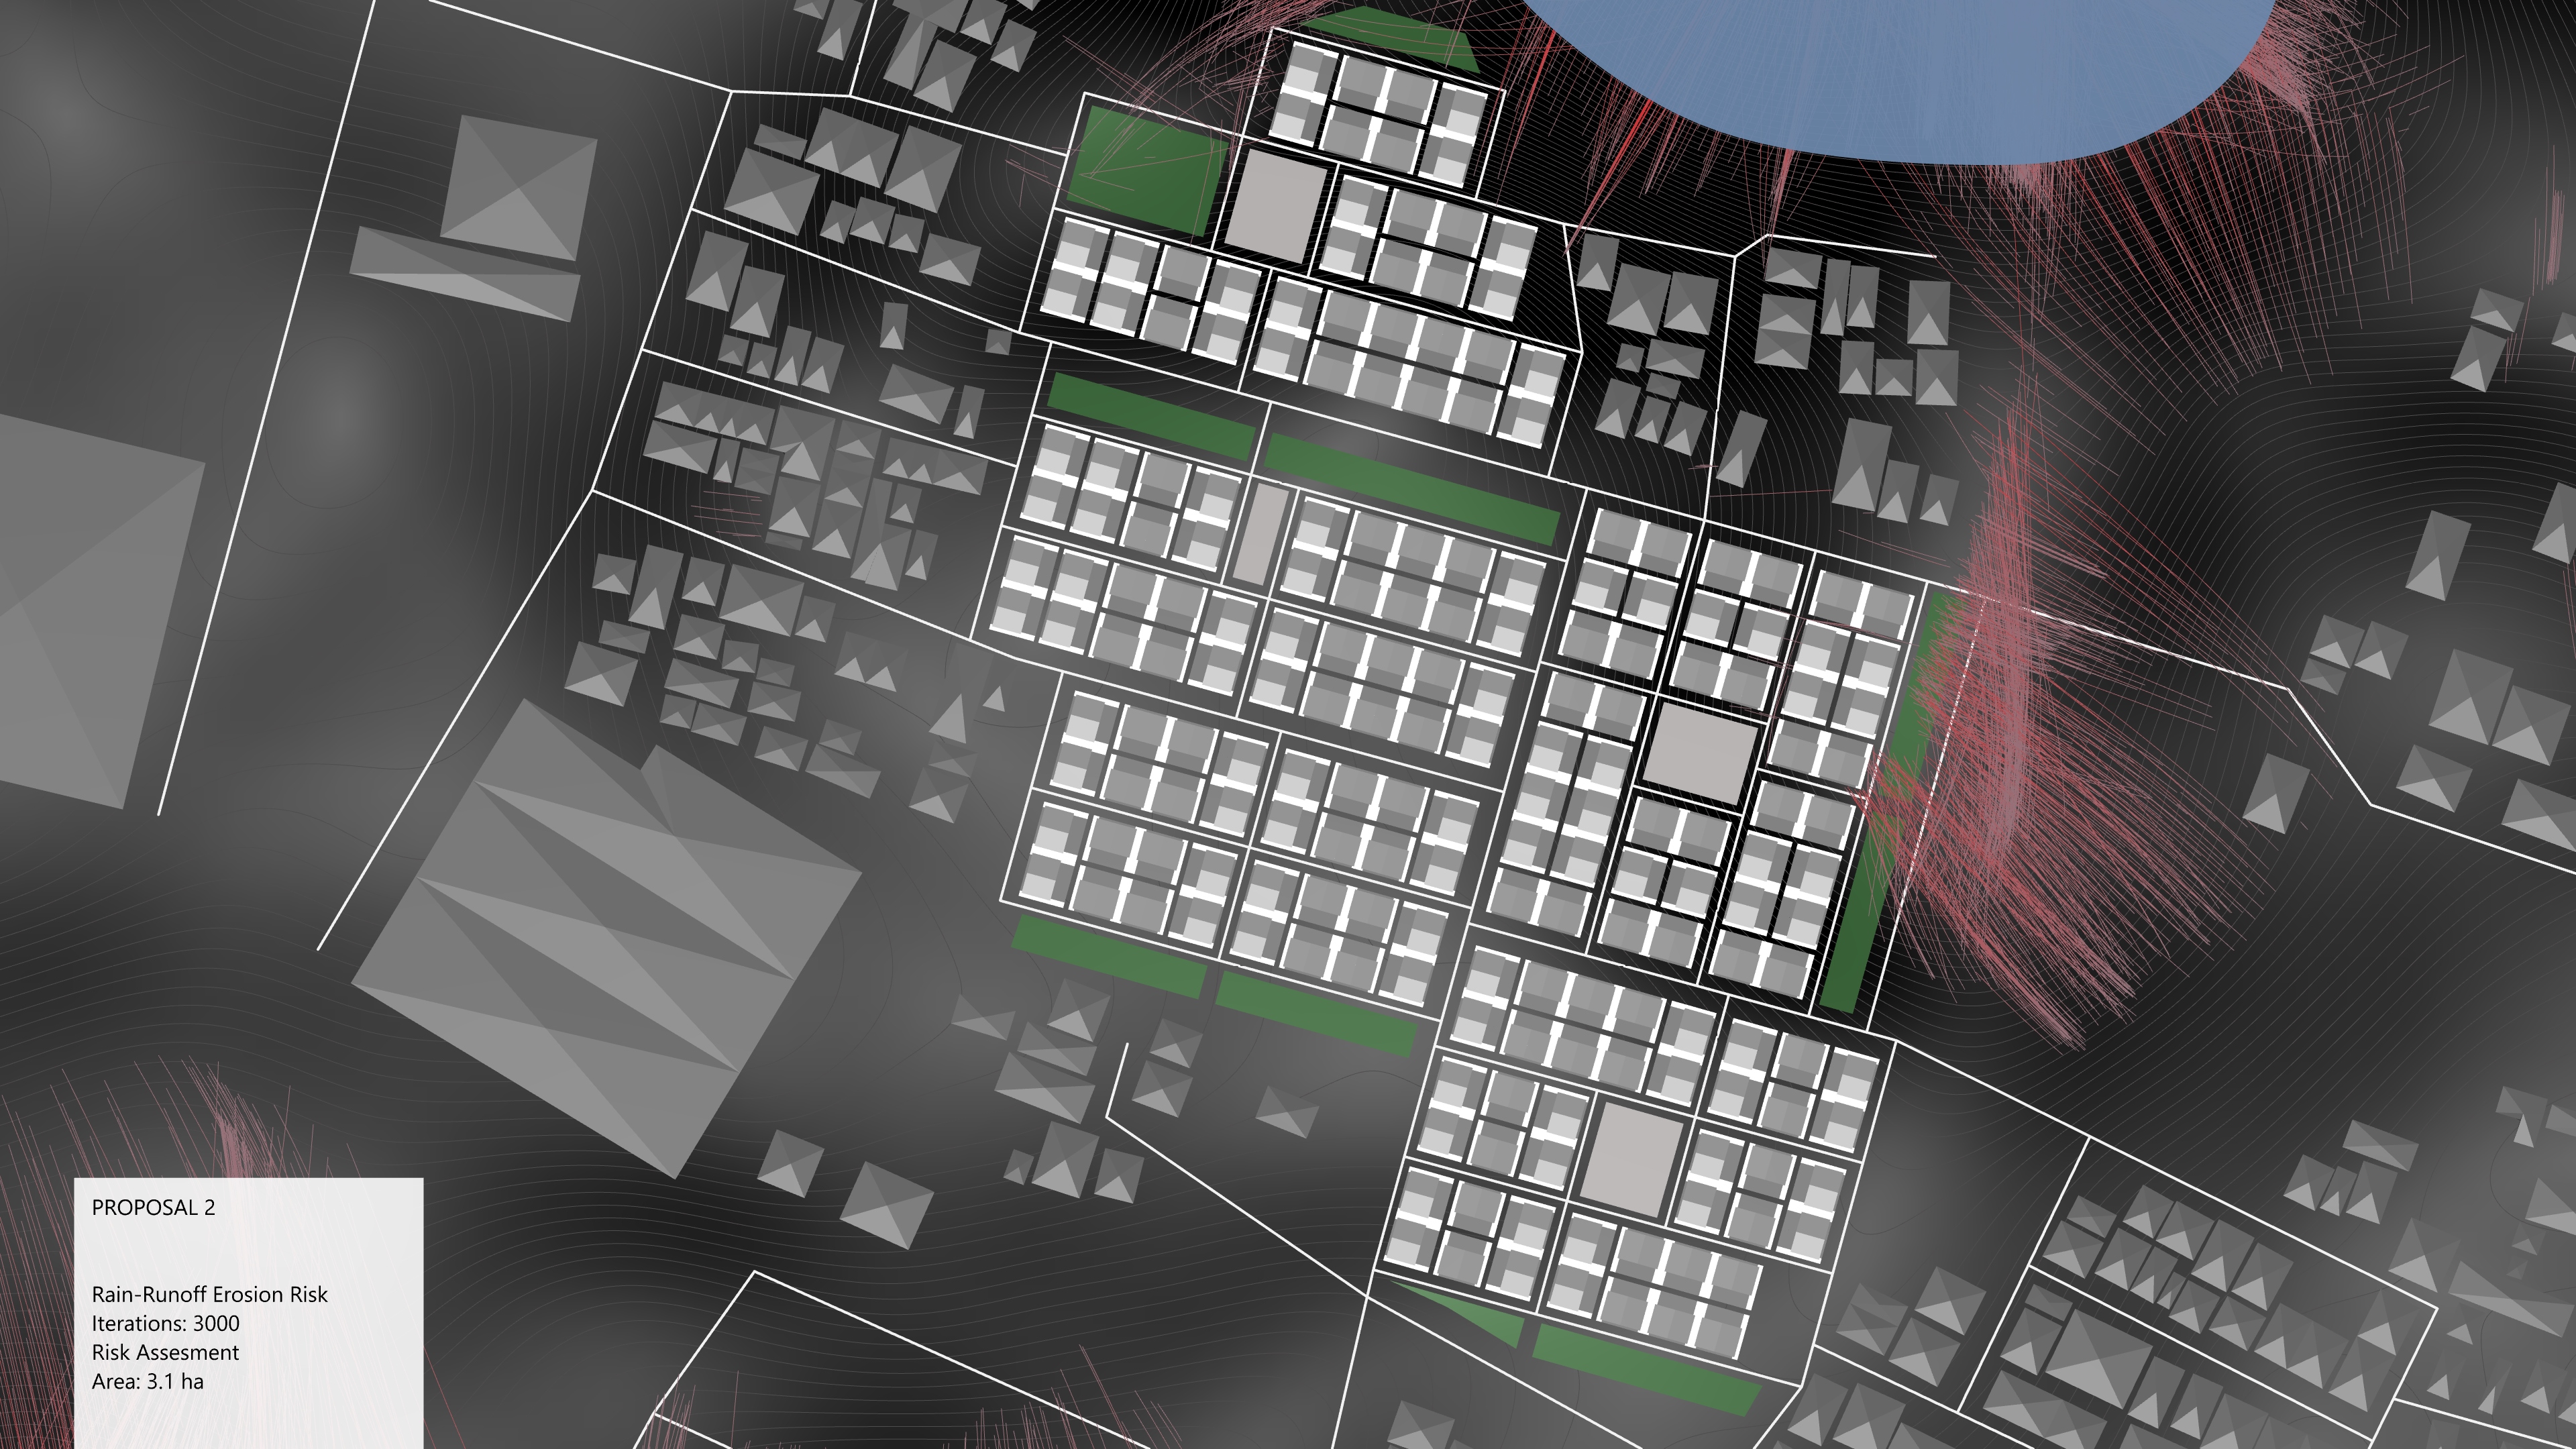
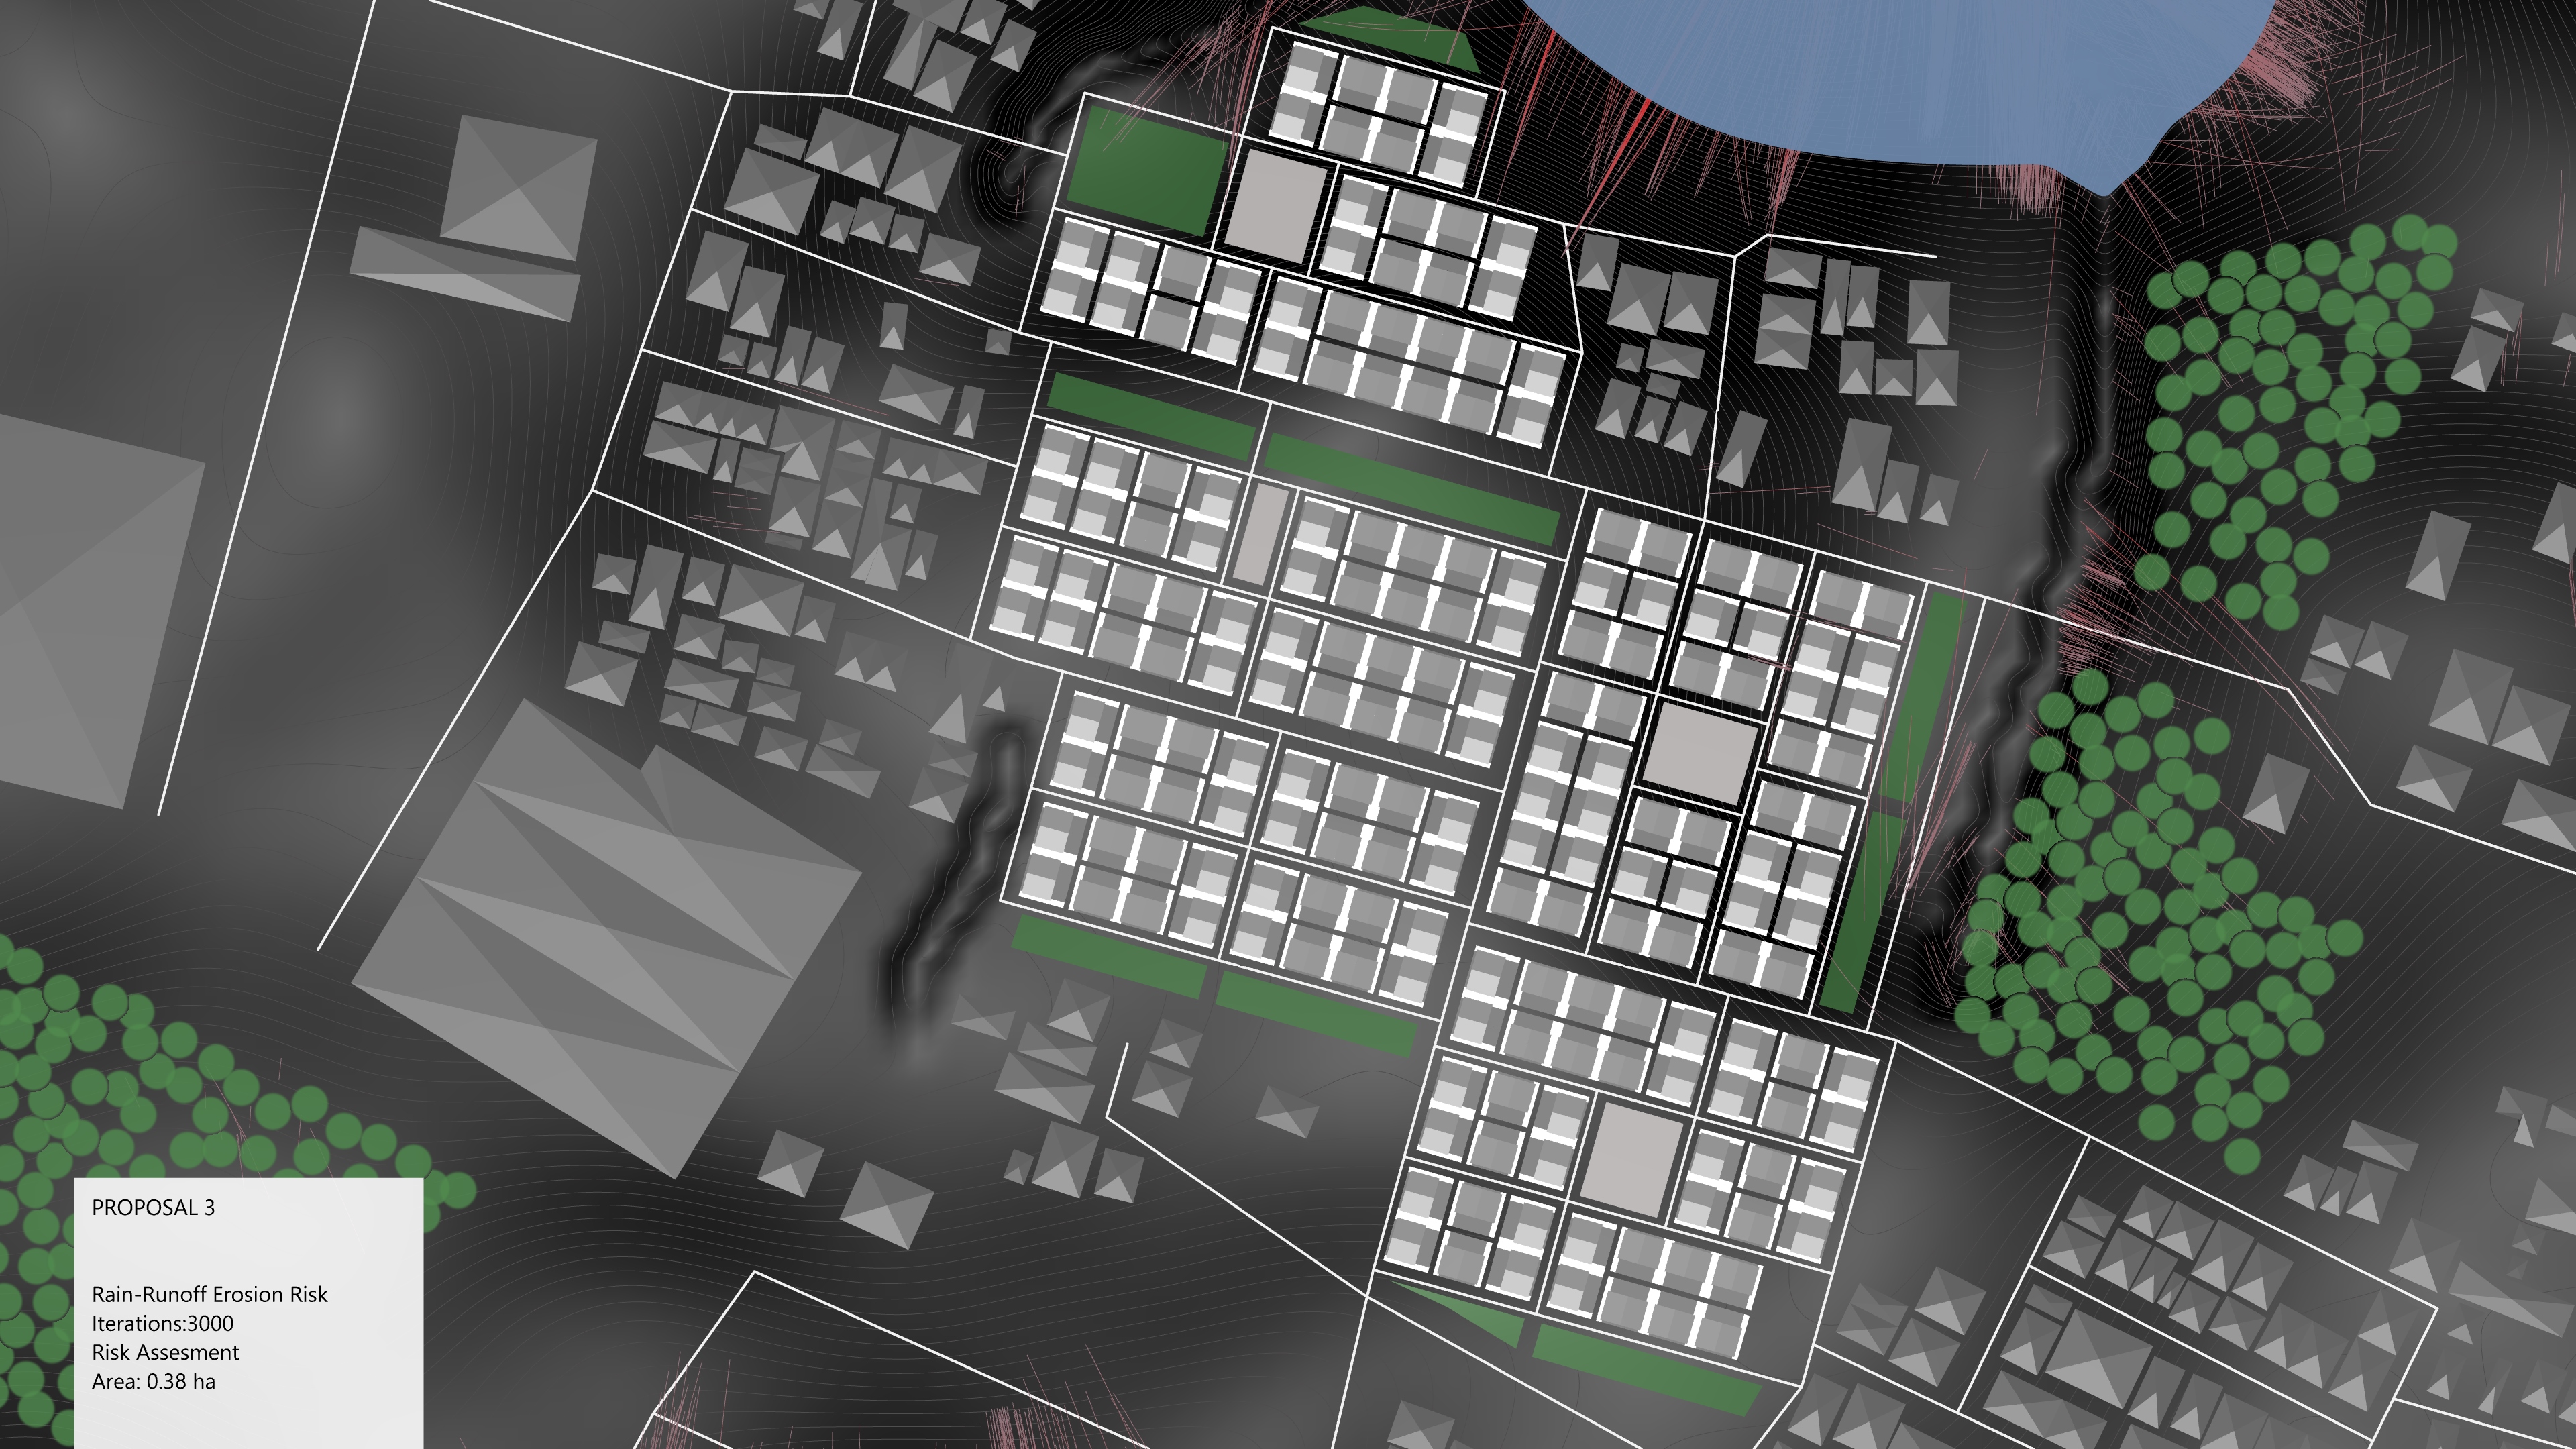
Sufficient green spaces are important in many ways. Forests in particular can improve air quality, protect soil from erosion and prevent rain from seeping into the ground too quickly. In addition, green spaces close to cities can also be used for recreation. However, they are also an important building material that requires space and time. So to what extend should forest be given space?


Employment
Agriculture cannot provide enough jobs for a growing population. New commercial and industrial land use can help here. If too few jobs are available, parts of the population will have to work in neighbouring cities or will not get a job. If too many are available, there is a danger that no one will be able to occupy them or that commuter traffic will be too high. With which mix of functions can a balanced employment be achieved?
Water & Affordability
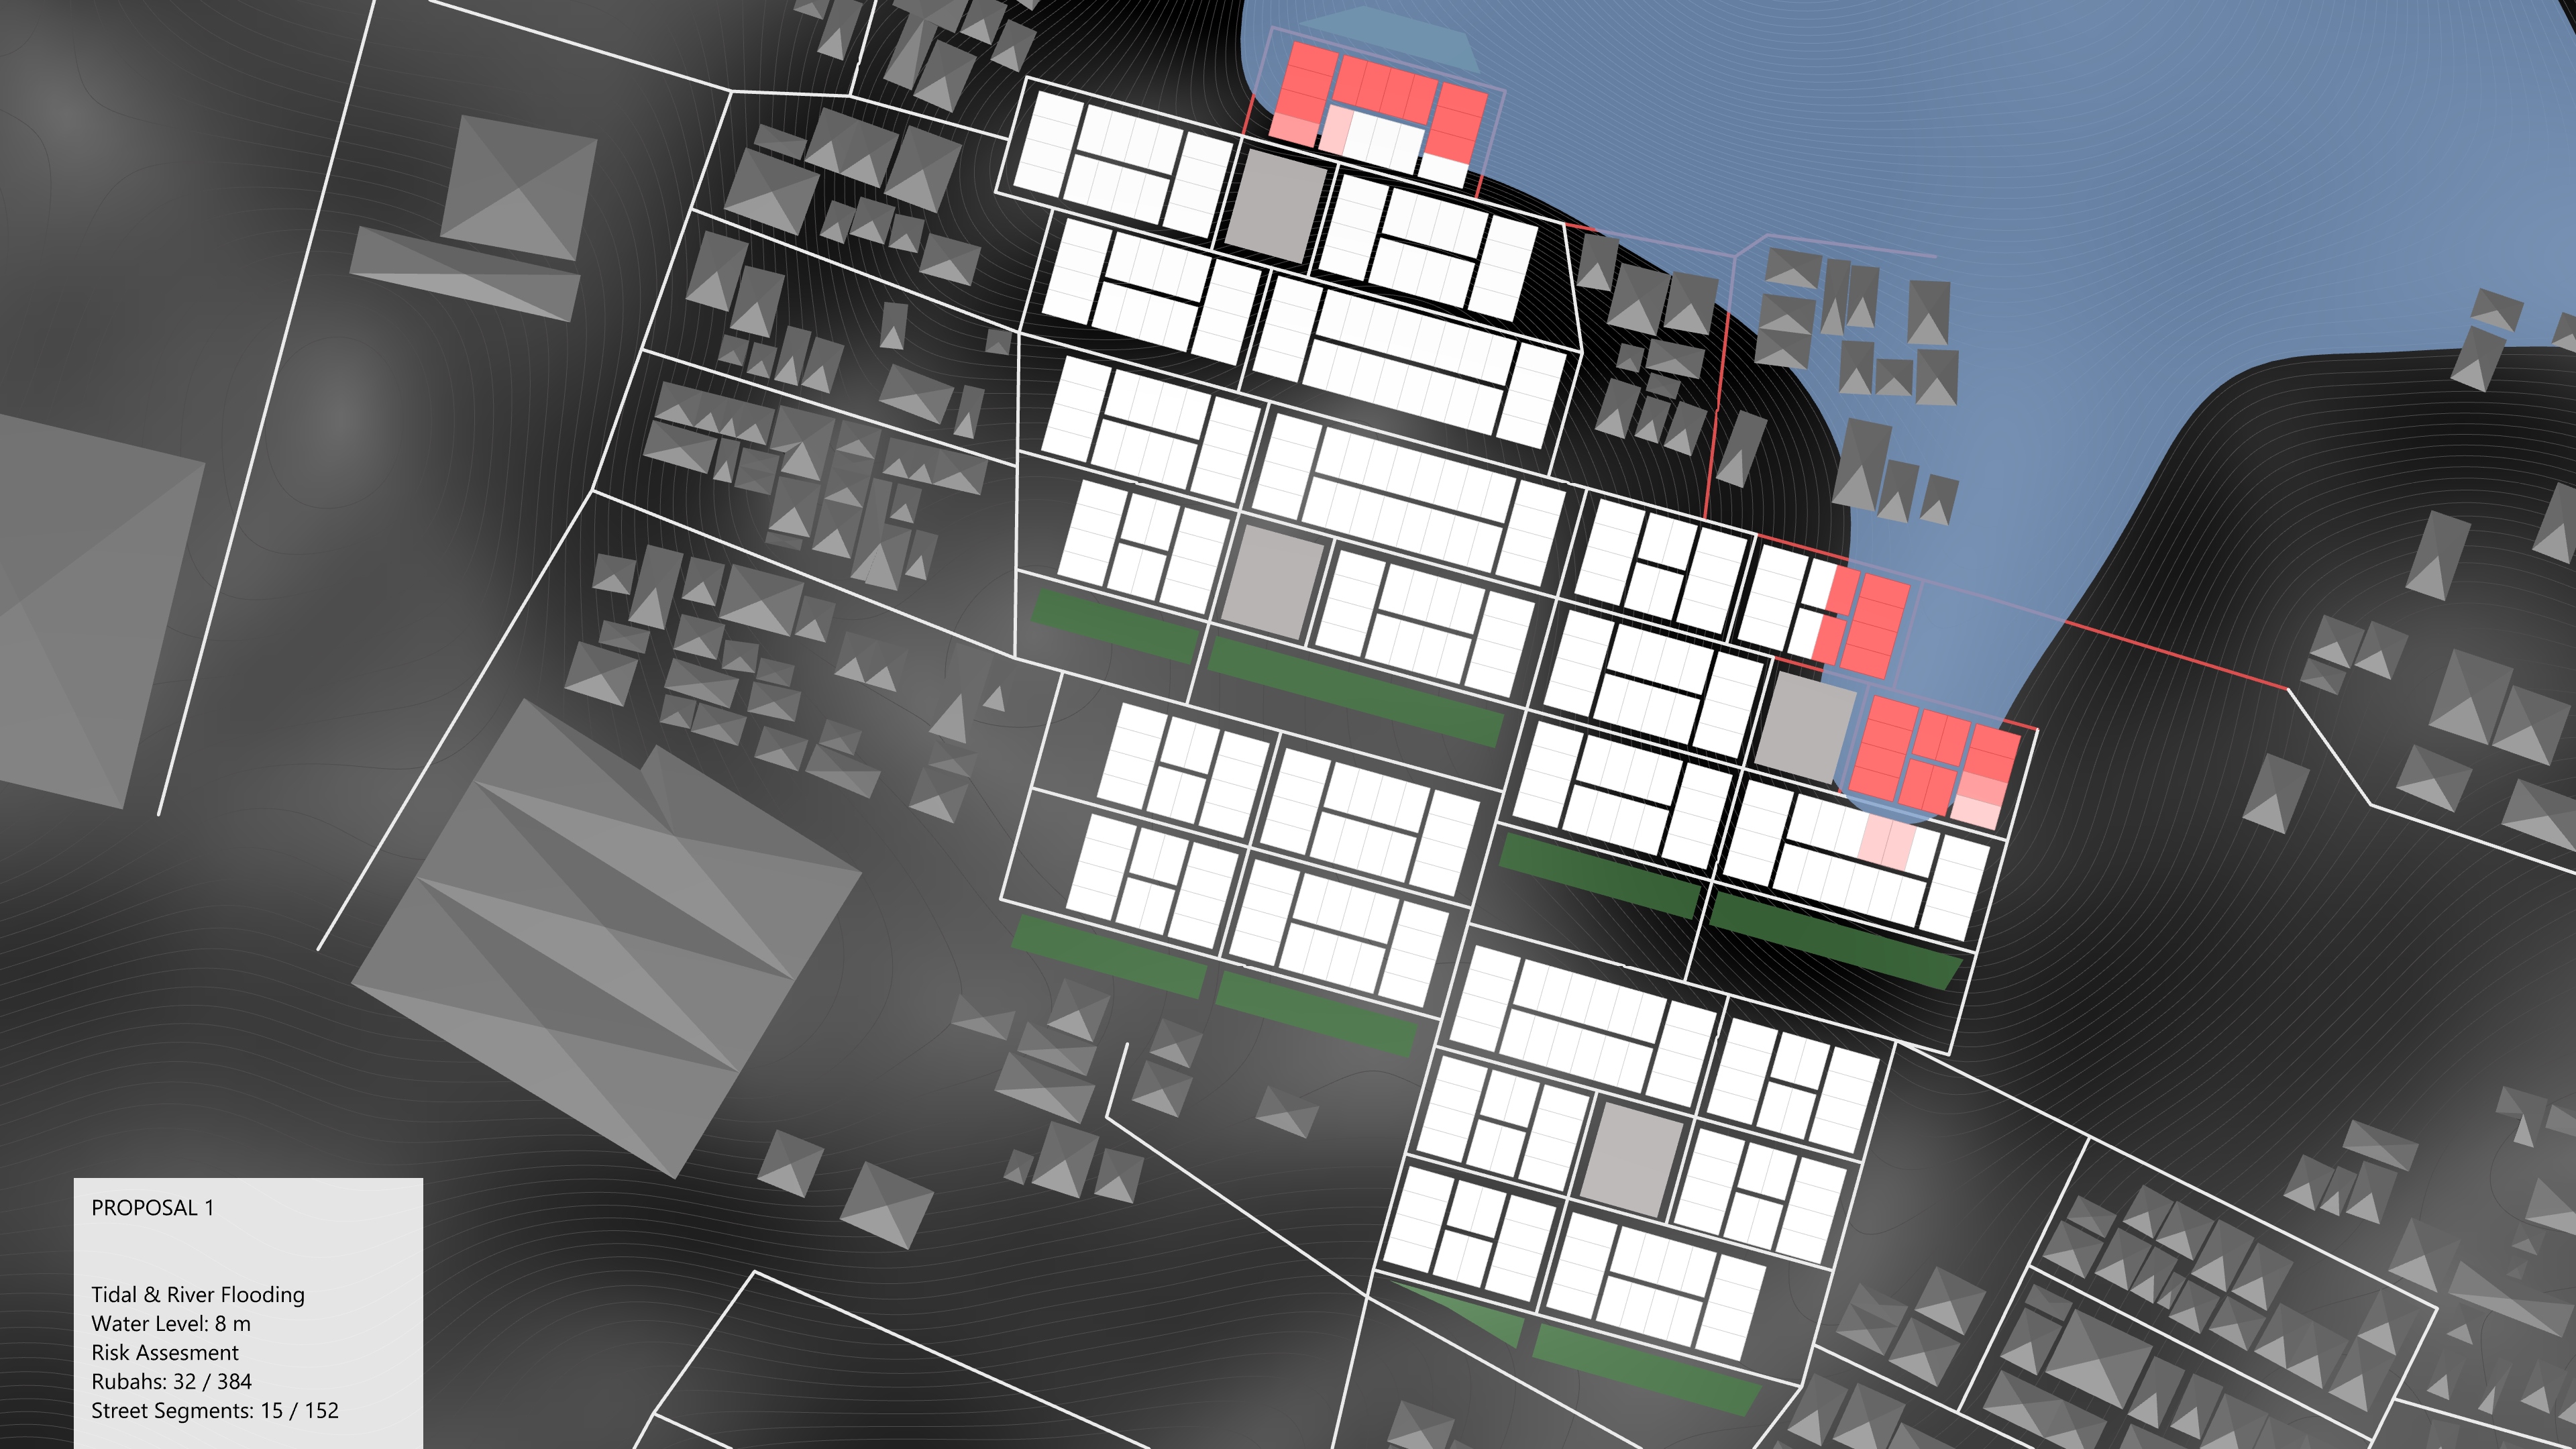
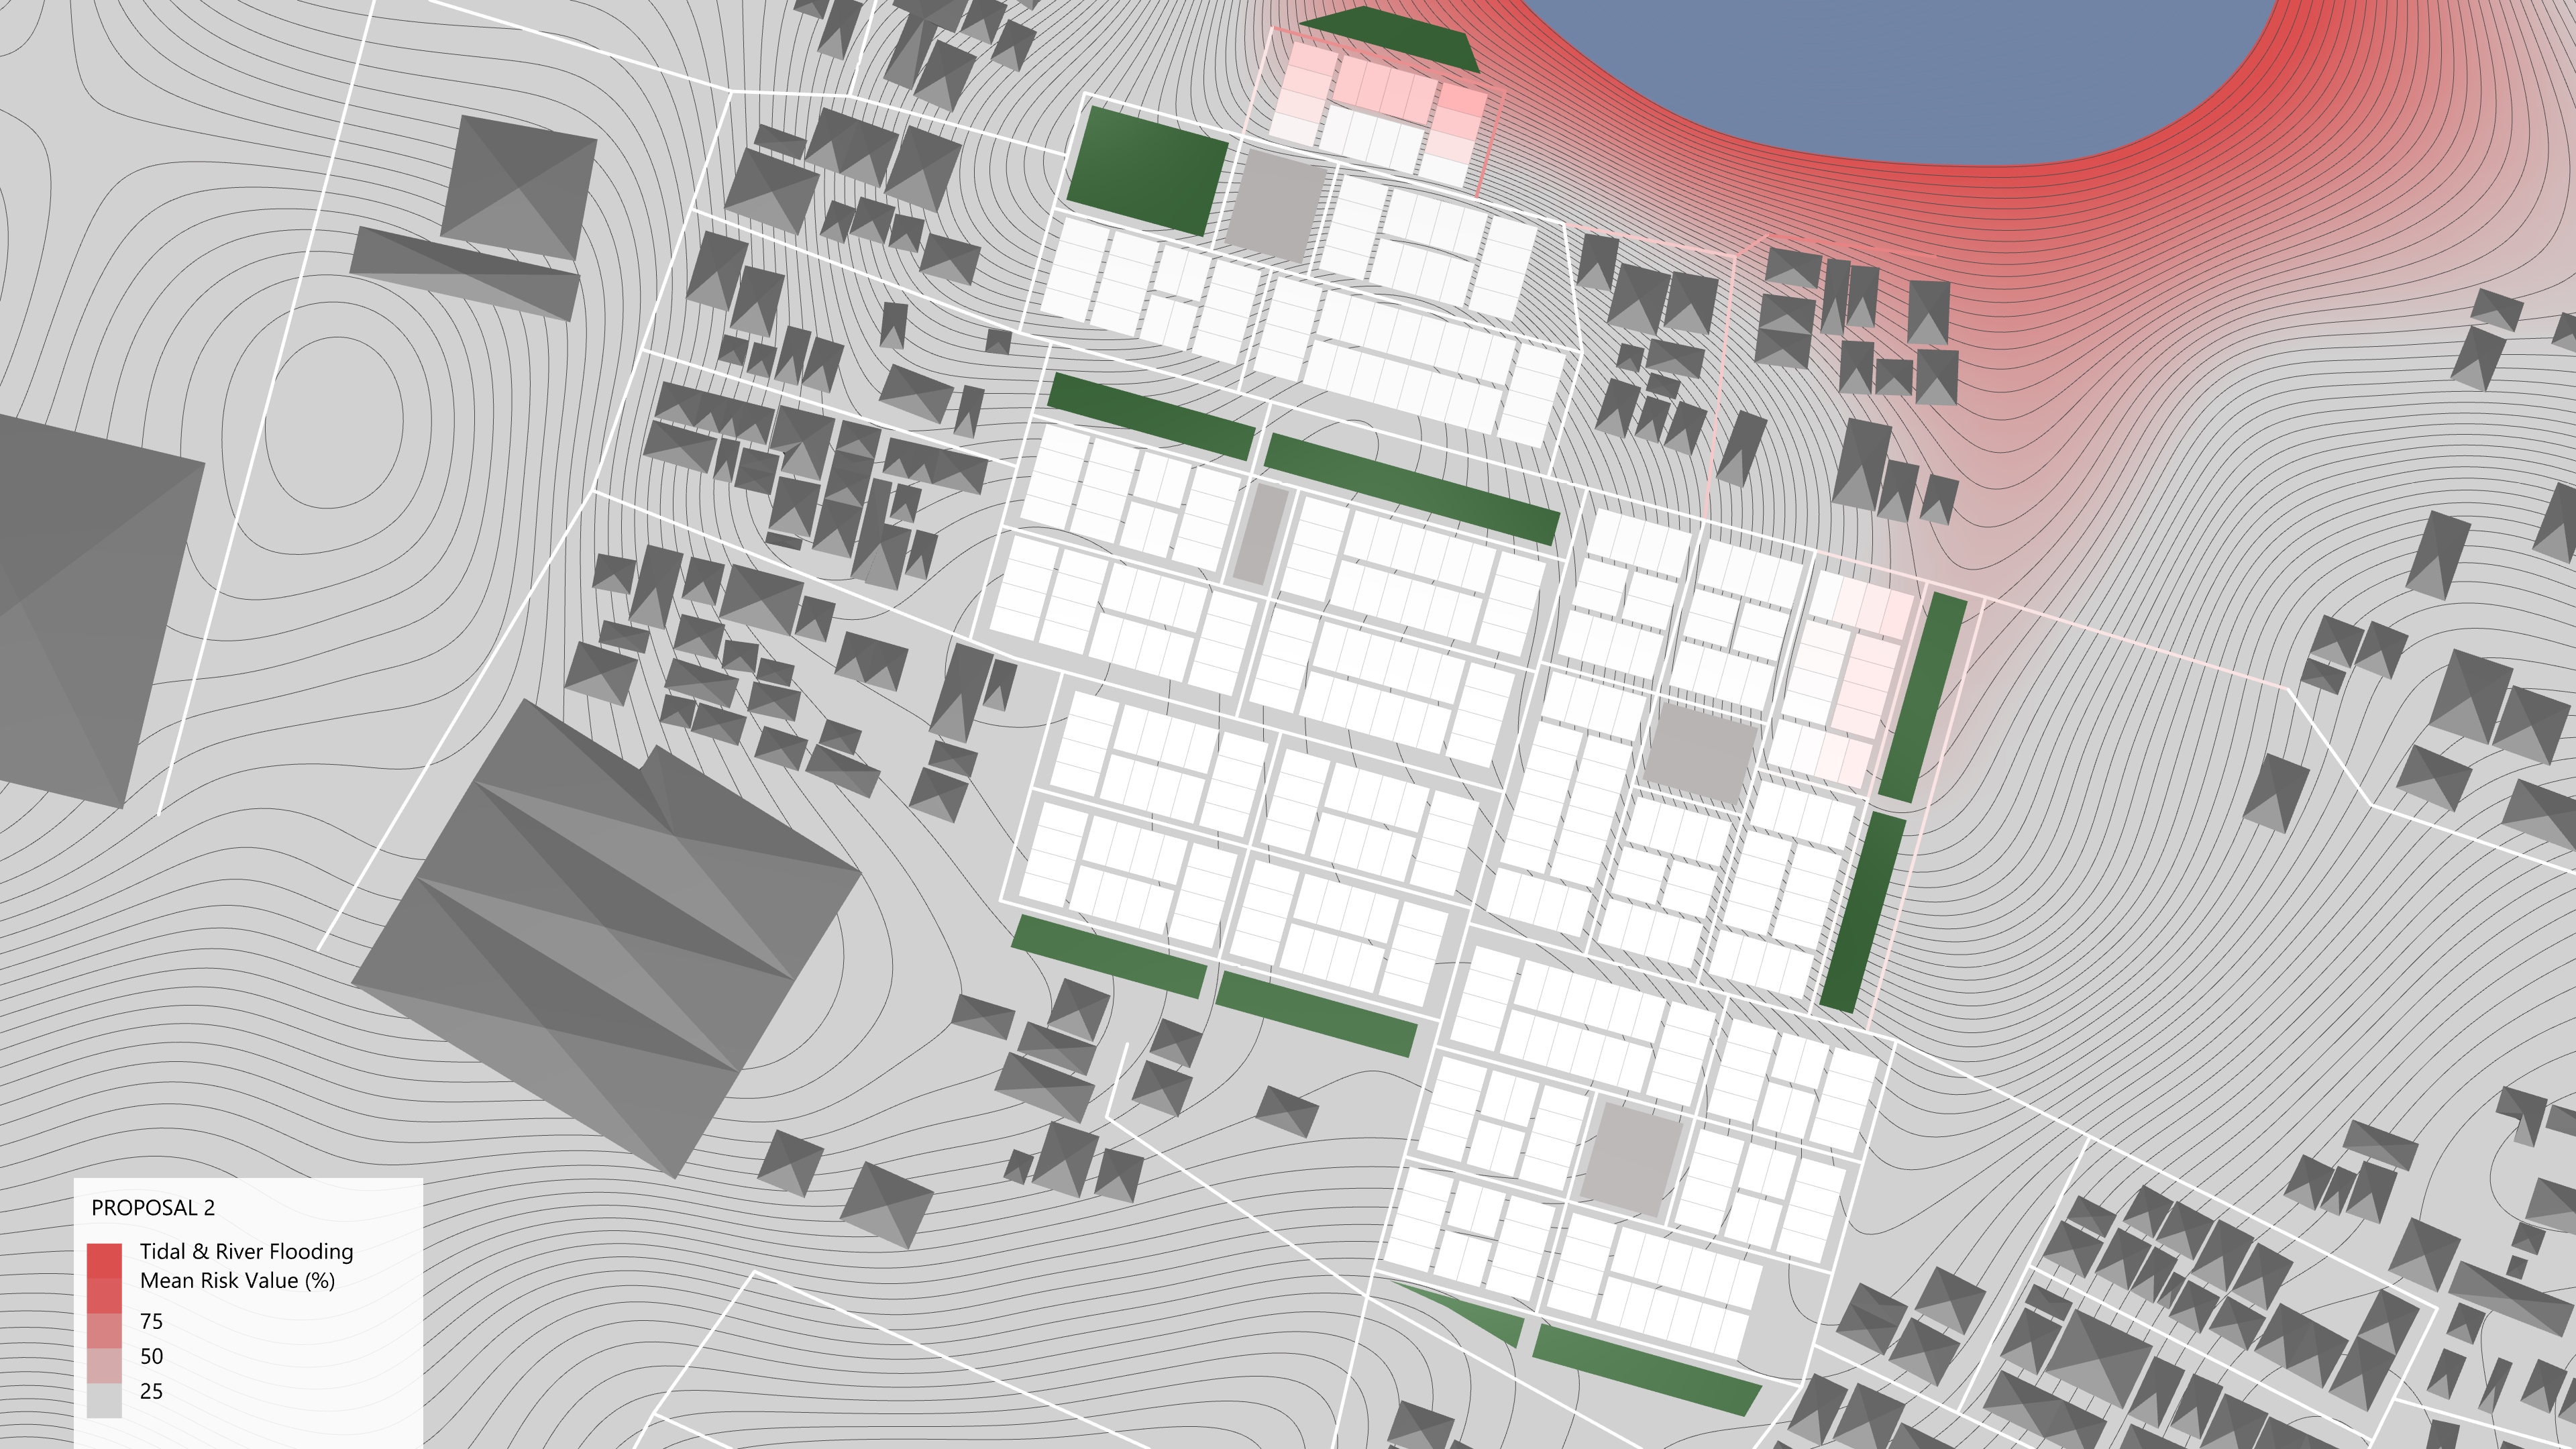
In order to supply a city with water, physical rules need to be considered. If there is not enough water pressure at a tap, no water flows. The pressure results from the difference in height between tank and tap, accordingly a water tank should be located high and close enough to the city. Furthermore, the larger a city is, the more expensive the infrastructure becomes. A dense city is therefore often cheaper to maintain. Where is an optimal location for a water tank for an affordable and complete water supply?


Air Quality
A city with fresh air has good conditions to be a healthy city. However, industry produces dirty exhaust air, which is blown into the residential areas by the wind. The local weather has east and west winds, depending on the day. The wind is visualised by the smoke clouds. So how should industry be placed to avoid pollution of the city?
By combining hard factors calculated by the computer with soft factors evaluated in discussion rounds. People who know little about urban planning can be involved in the early stages of the planning process and gain important decision-making competencies. According to the feedback given to us, we will continue improving and extending our tools and hope to share the results in the near future.


Acknowledgement
Integrated Infrastructure (IN³ – uni-weimar.de/integrated-infrastructure) is an interdisciplinary international research project at the Bauhaus-Universität Weimar (BUW) and the Ethiopia Institute for Architecture, Building Construction and City Development (EiABC) working within the Emerging Cities Lab – Addis Ababa (ECL-AA).
The urban planning table is conceptualised and developed within the Integrated Infrastructure Research Team.
EiABC: Zegeye Cherenet, Tesfaye Hailu, Ephrem Gebremariam, Kirubel Nigussie, Metadel Selashi, Bilisaf Teferri, Israel Tesfu
BUW: Andreas Aicher, Nicole Baron, Martin Dennemark, Philippe Bernd Schmidt, Sven Schneider
Interface design and programming of the planning table by Martin Dennemark
The project is funded by the Federal Ministry of Education and Research in Germany (BMBF), German Academic Exchange Service (DAAD) and German Aerospace Center (DLR).
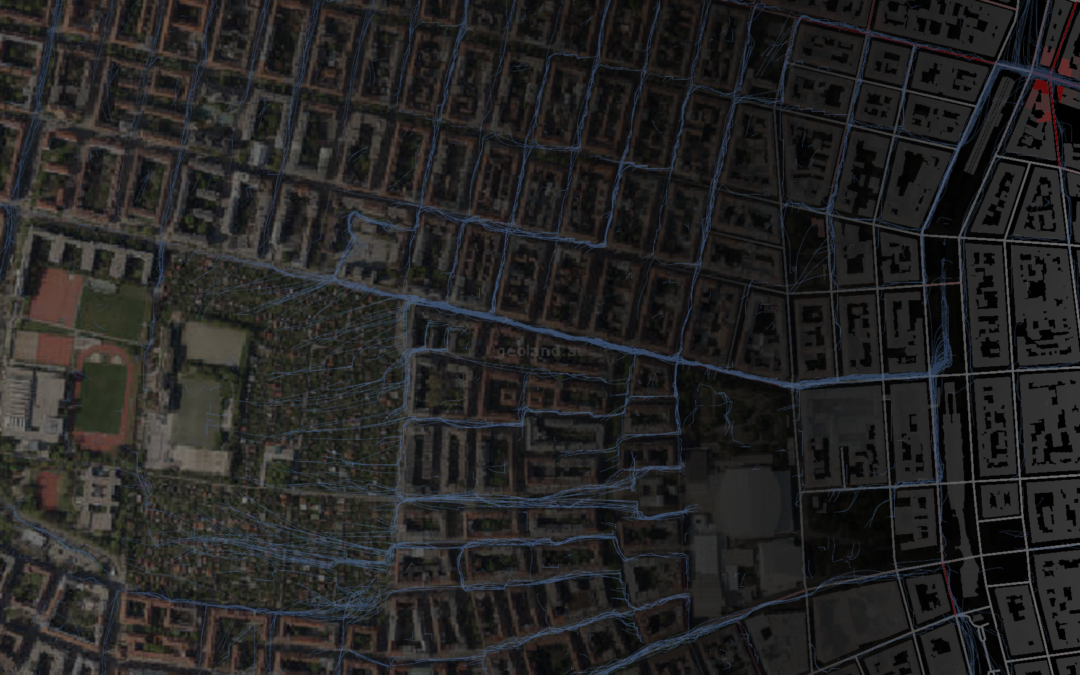
Satellite imagery aquired through educational license from © Planet Labs Inc. www.planet.com.