Spatial Resilience Towards Flooding Hazards
Urban development projects in flood-prone areas are usually complex tasks where failures can cause disastrous outcomes. To tackle this problem, we introduce a toolbox (Spatial Resilience Toolbox – Flooding, short: SRTF) to integrate flooding related aspects into the planning process. This so-called toolbox enables stakeholders to assess risks, evaluate designs and identify possible mitigations of flood-related causes within the planning software environment Rhinoceros 3D and Grasshopper. This states a convenient approach to integrating flooding simulation and analysis at various scales and abstractions into the planning process. The toolbox conducts physically based simulations to give the user feedback about the current state of flooding resilience within an urban fabric. It is possible to evaluate existing structures, ongoing developments as well as future plans. The toolbox is designed to handle structures on a building scale as well as entire neighborhood developments or cities. Urban designers can optimize the spatial layout according to flood resilience in an early phase of the planning process. In this way, the toolbox can help to minimize the risk of flooding and simultaneously reduces the cost arising from the implementation and maintenance of drainage infrastructure.
Research Team: Julius Morschek (contact author), Reinhard Koenig (contact author) and Sven Schneider
Acknowledgment
This page contains accompanying material for the SimAUD 2019 conference paper “An integrated urban planning and simulation method to enforce spatial resilience towards flooding hazards“.
Presentation at SimAUD conference, Georgia Tech, Atlanta GA, April 2019
RAIN-RUNOFF SIMULATION
The rain runoff simulation is conducted with the help of the interactive physics/constraint solver Kangaroo for Grasshopper by Daniel Piker. The toolbox can represent a rainfall event by equipping particles with a certain mass and gravitation force. During the simulation, the particles are attracted by the external gravitational force, which results in runoff. Thereby, the particles search for ways downwards comparable to rain runoff. They behave as spherules running off the 3D geometry.
TIDAL & RIVER FLOODING SIMULATION
The second simulation the toolbox is capable of is the tidal and river flooding simulation. It illustrates and evaluates the impact of different water levels in the area. To measure the inundation, a plane is moved from a given altitude up to a predetermined value. The plane is considered as the surface area of a river, lake or the sea. To get precise information about which part of the geometry is flooded, the toolbox calculates the intersection between the plane and the surroundings.
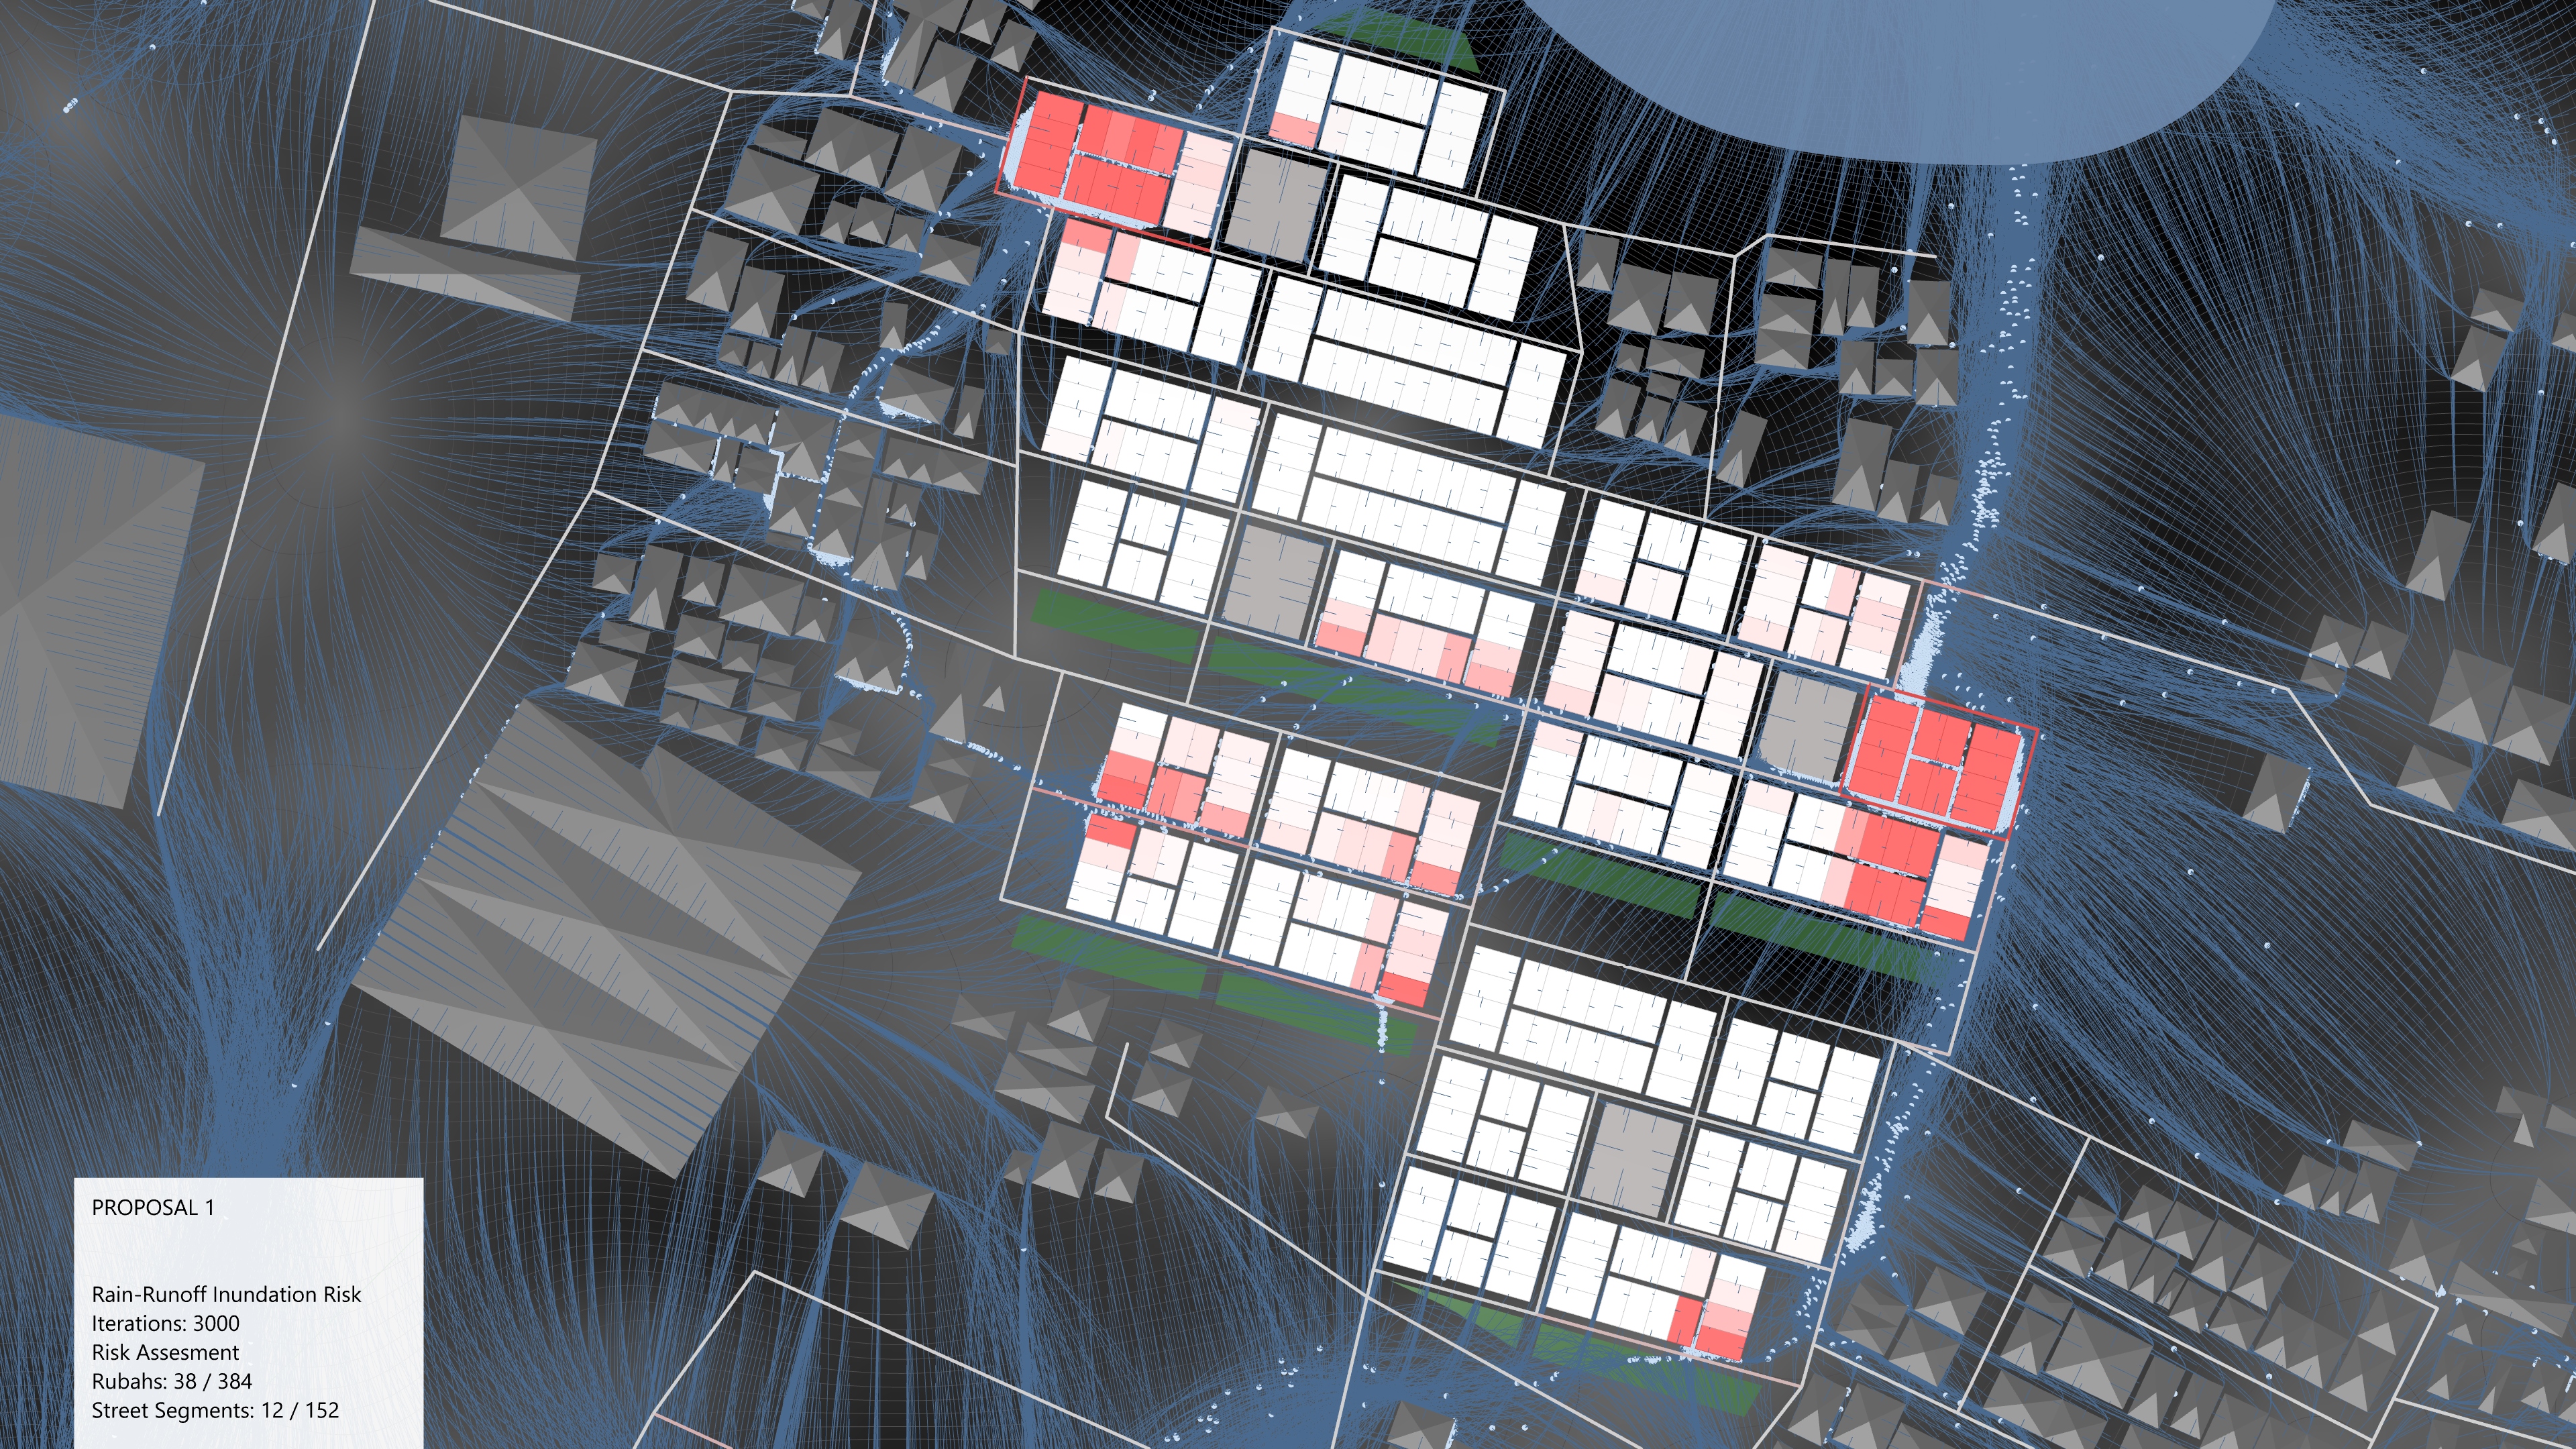

RAIN-RUNOFF INUNDATION RISK
The SRTF provides information about the status of flooding-resilience for urban inundation, tidal and river flooding. The rain-runoff simulation provides information about the status of inundation and the level of erosion in the area.
The risk assessment of the rain runoff inundation is conducted based on the location of each particle after the simulation. The toolbox counts the number of particles that are in a specific range within every building. The range is set to two meters by default. This allows compromising the rating of a building in a negative way when it is surrounded by water under pressure. The value of the range distinguishes water that is running along the housing units from water that accumulates and pushes against buildings. Then the number is divided by the footprint area of each building. The higher the value the greater the risk of damages through flooding. This means that the density of particles near or at the buildings is responsible for the outcome of the evaluation. Buildings with a high risk of inundation are always characterized by an accumulation of particles nearby. The street network is treated similarly. Each street is further divided into segments at junctions or bends. Then the number of particles measured that are within a specific range near each street segment. The value is the same that is used for the housing units. The number is then divided by the area of the range. Now each building and each street segment is assigned with specific risk value. The information is visualized with color gradation in the viewport.
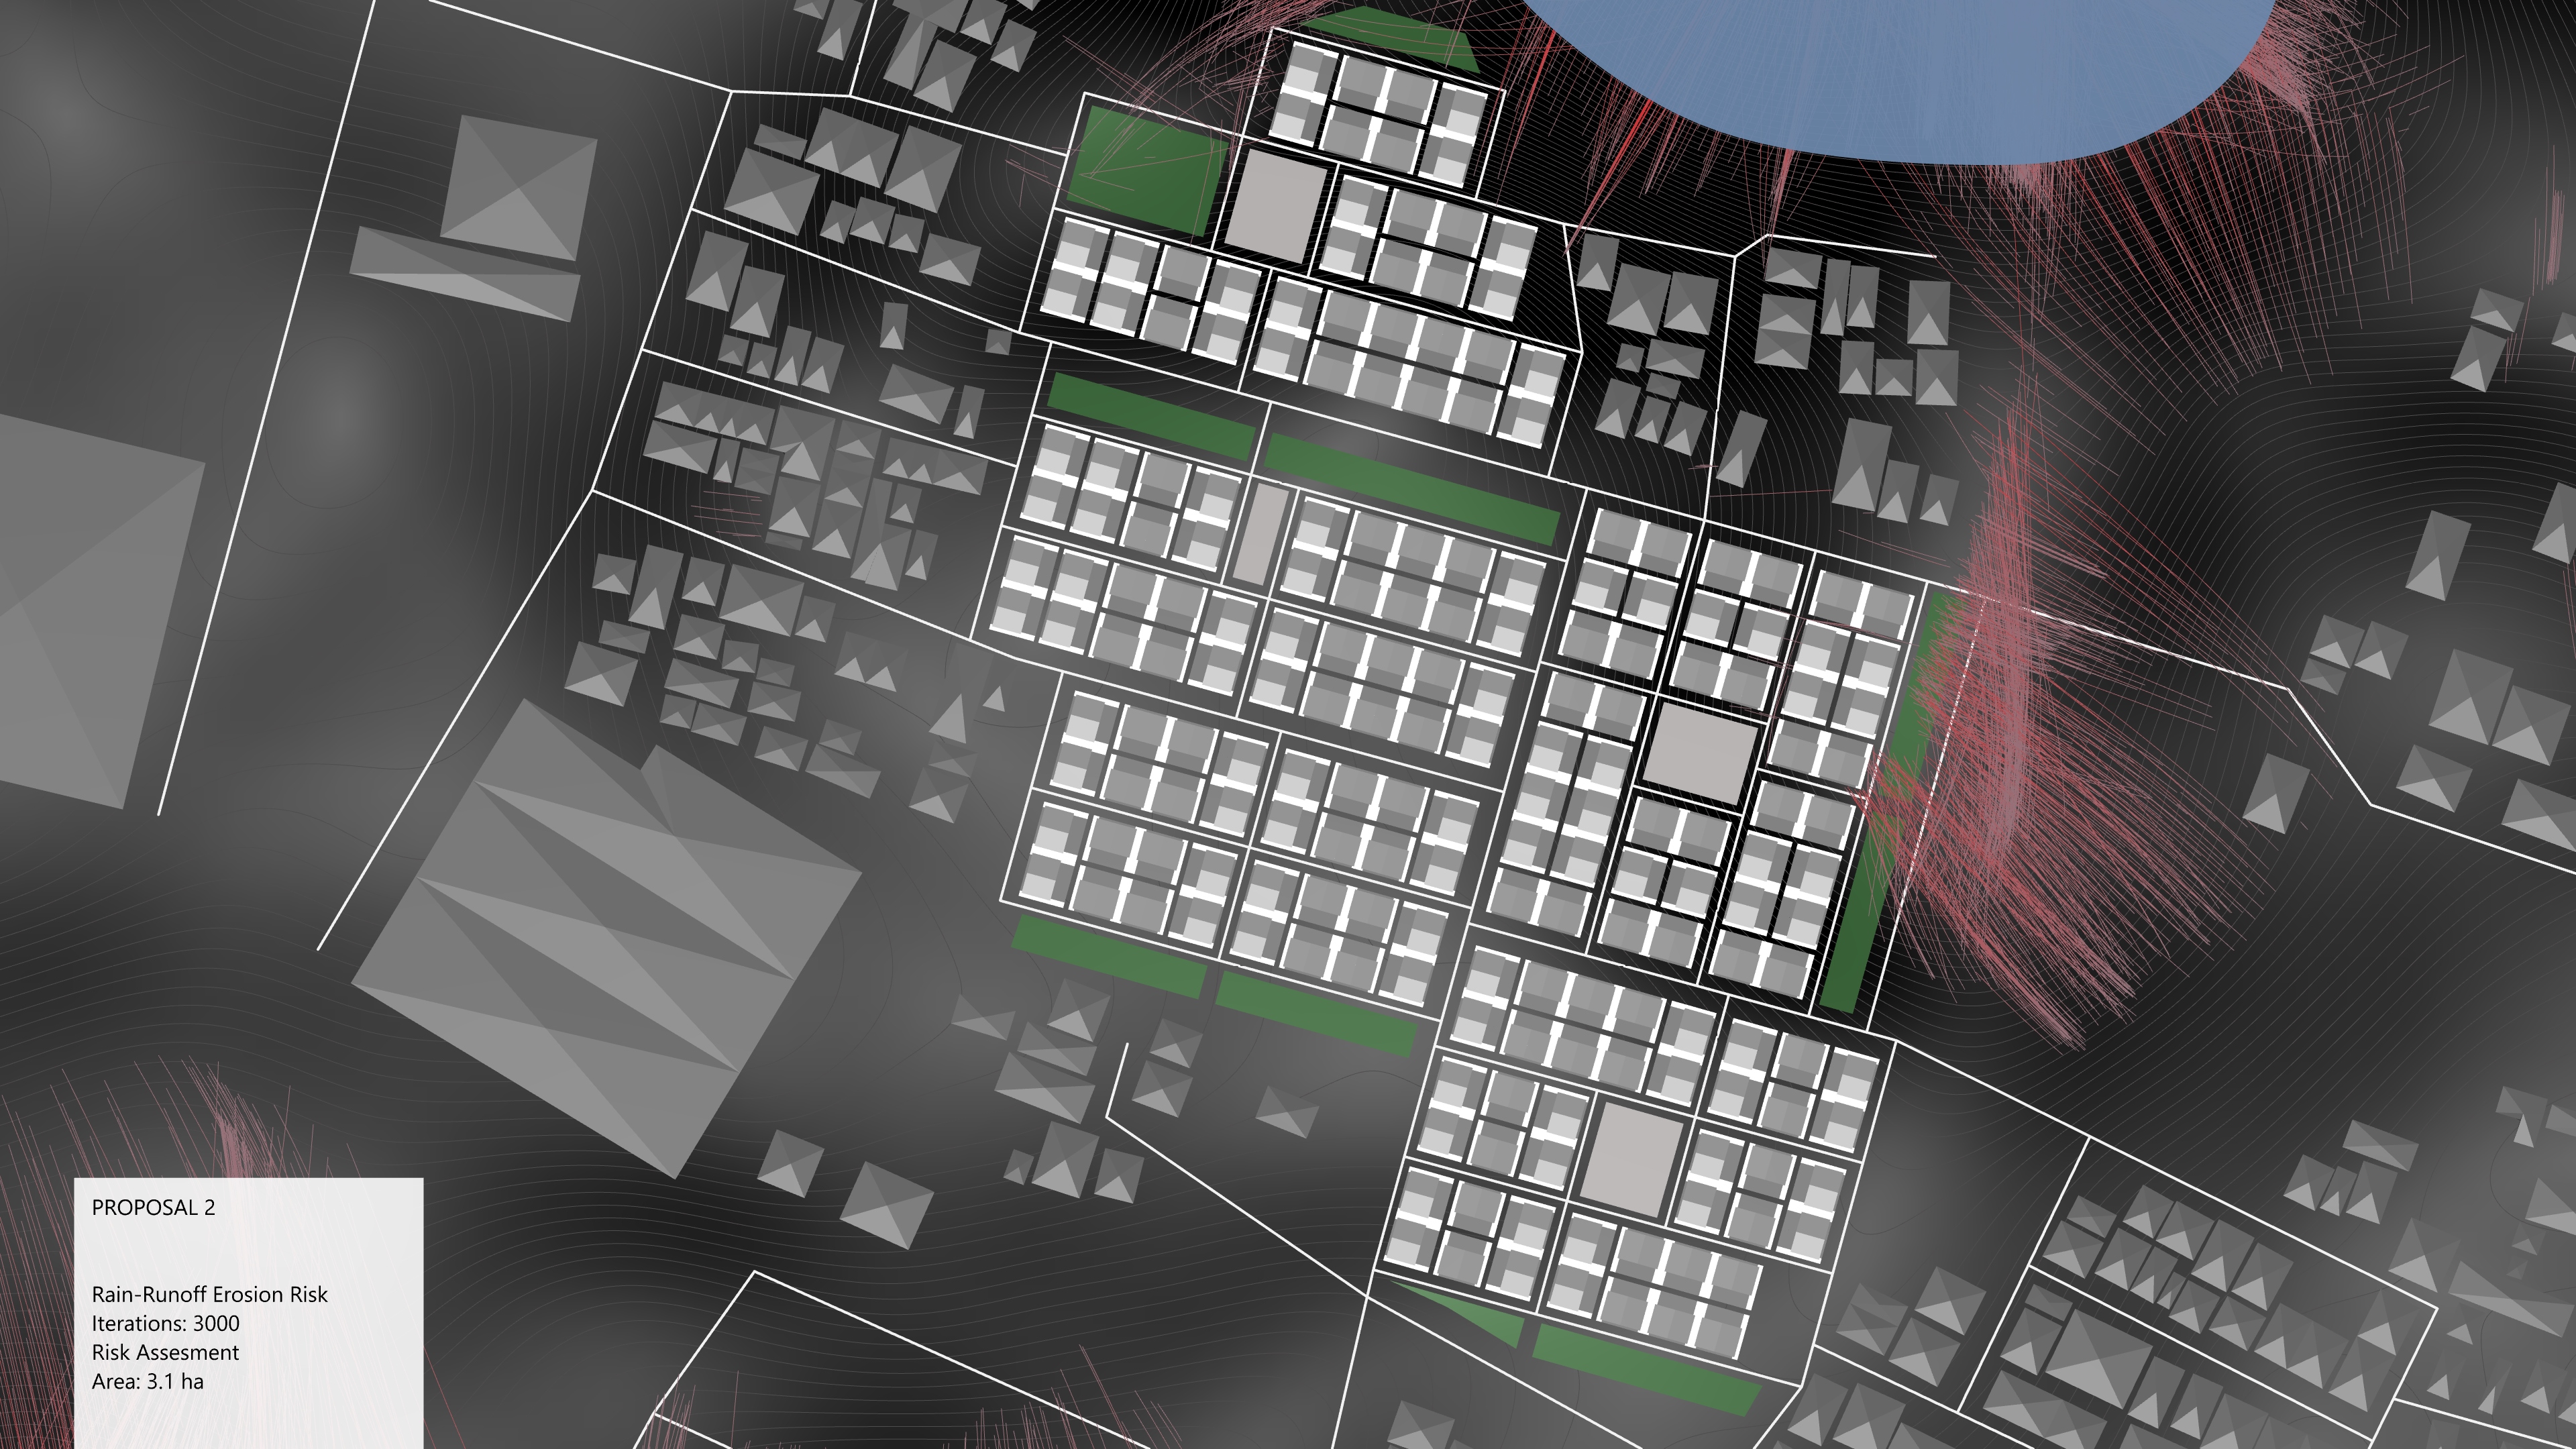

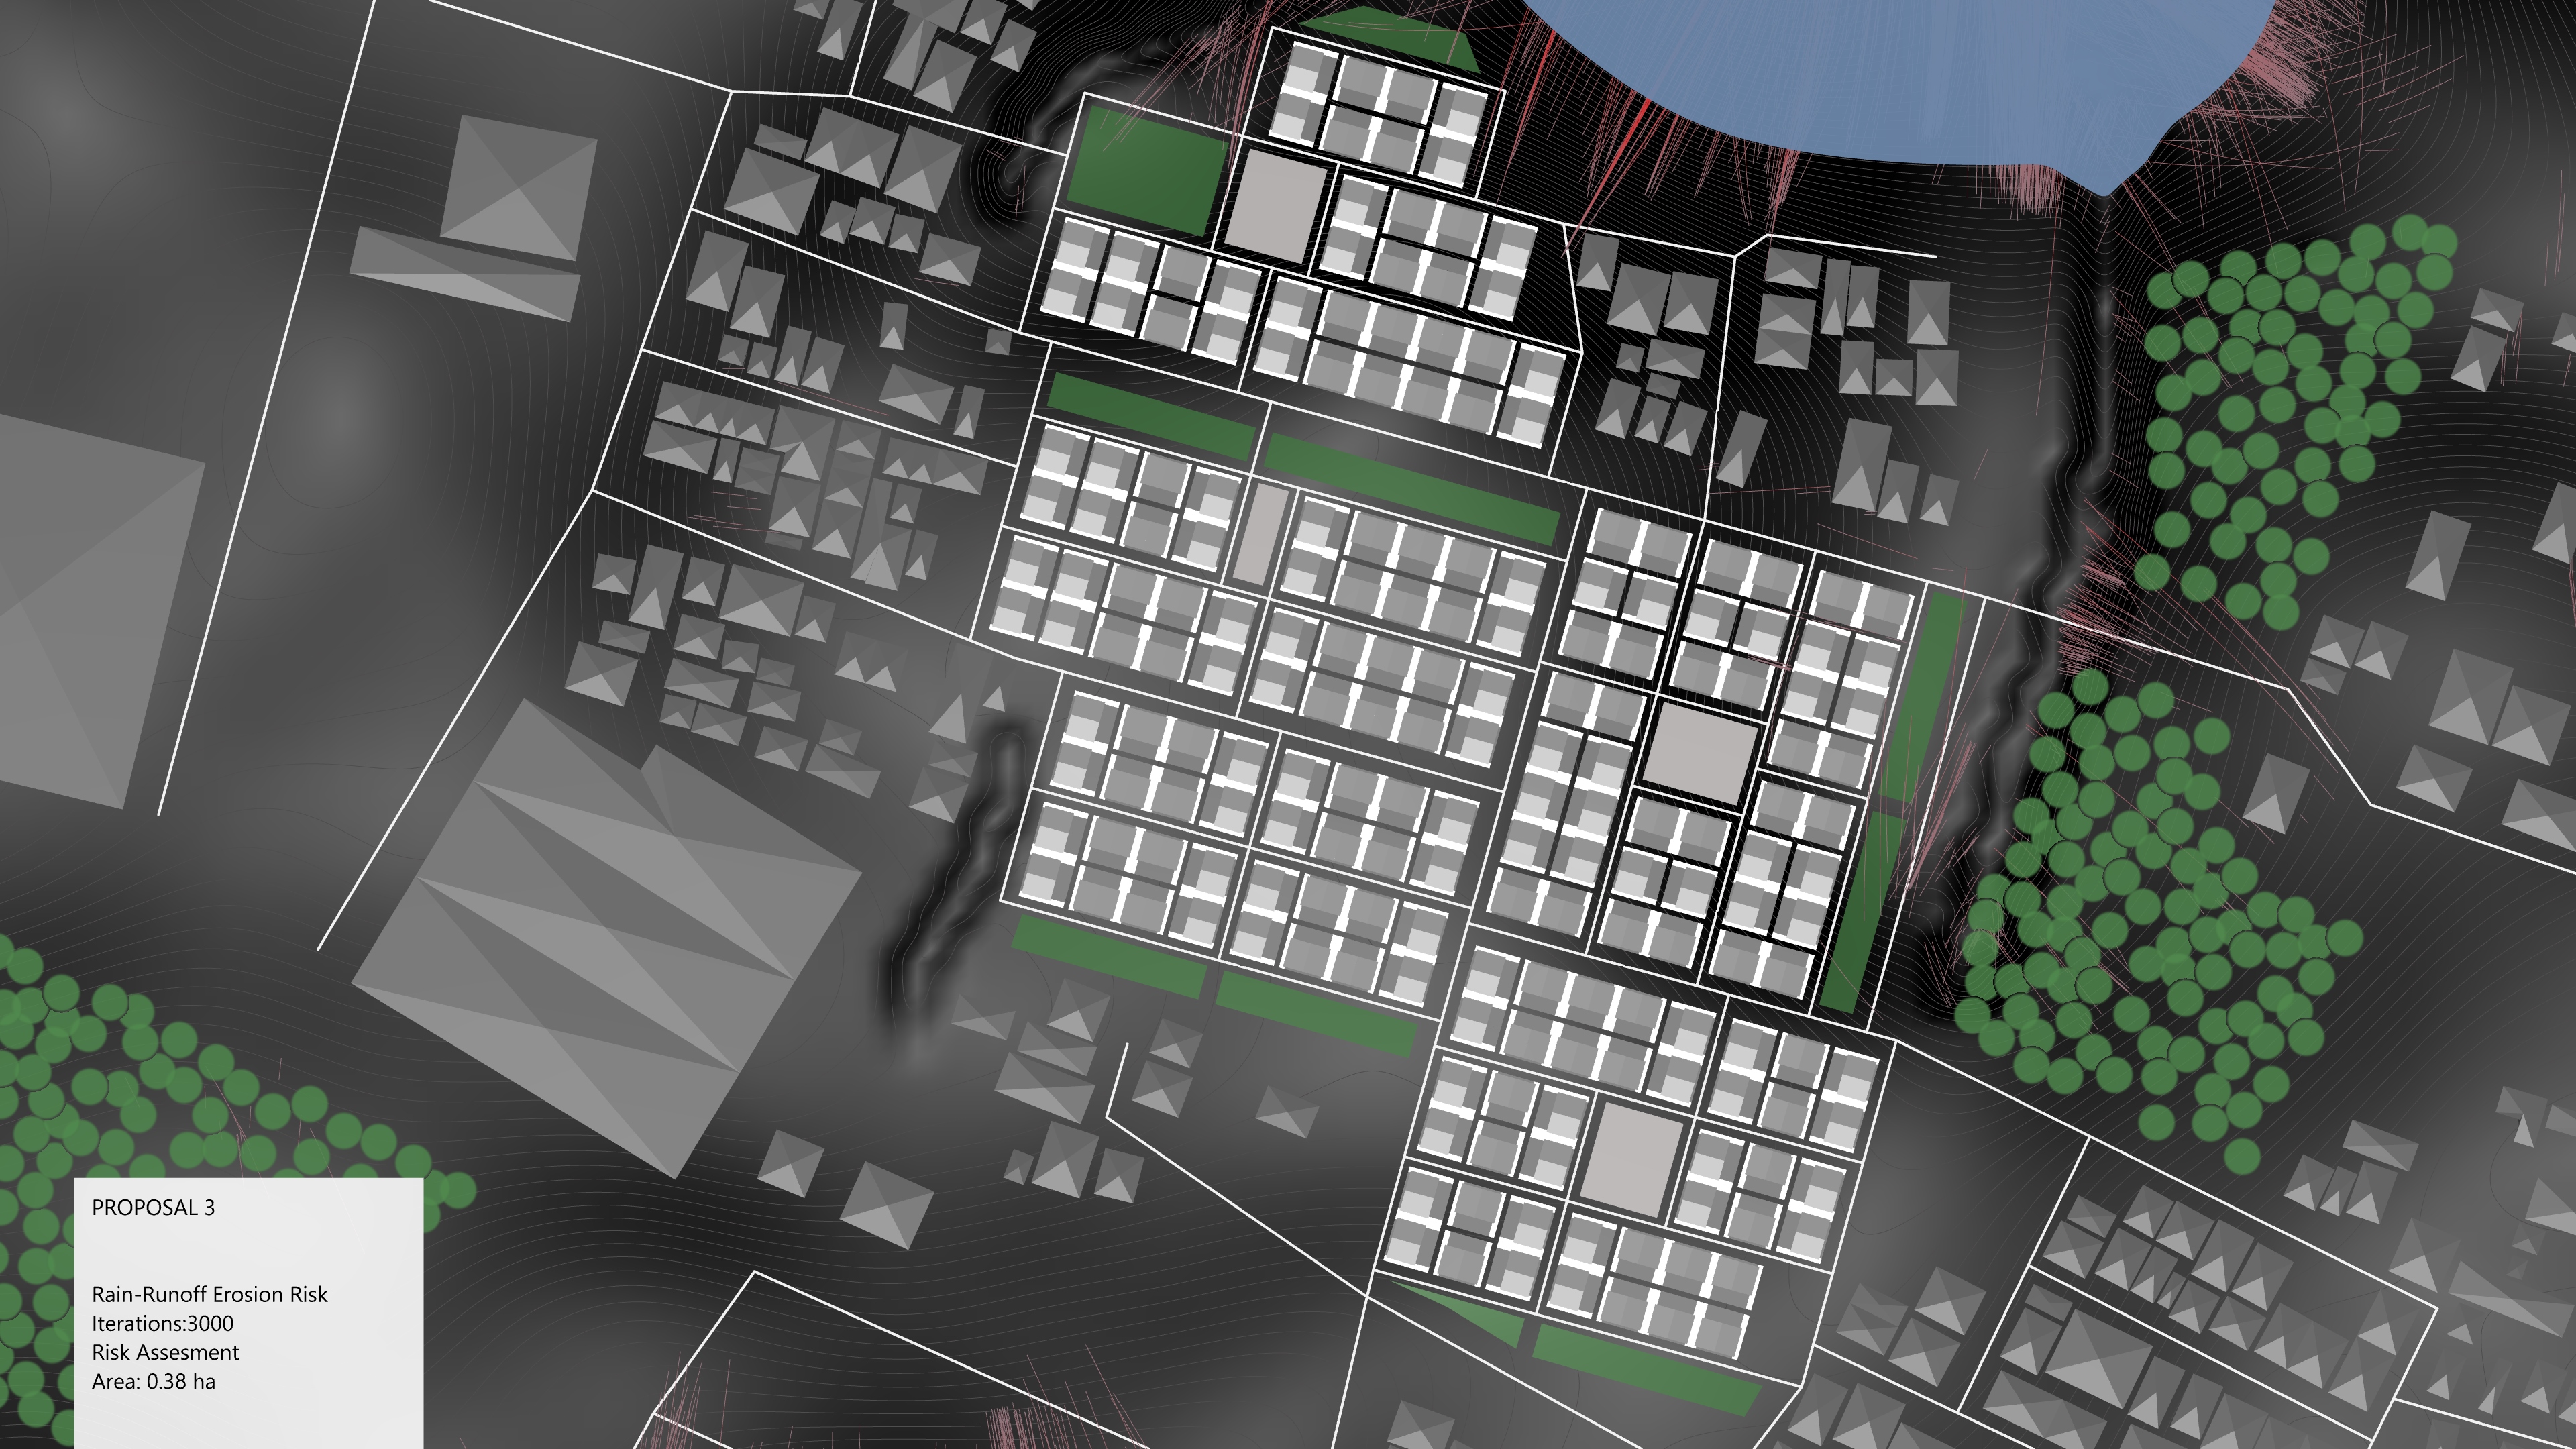
RAIN-RUNOFF EROSION RISK
With the outcome of the rain runoff simulation, one can also conduct the rain-runoff erosion risk evaluation. Hereby the path of each particle is used to evaluate the runoff erosion risk. This helps to mitigate fast runoff and therefore the risk of damages caused by erosion, debris, and landslides. Urban planners can take this information into account when developing buildings, neighborhoods or cities. The toolbox visualizes the evaluation by means of the flow paths. Combined with the description of the velocity the user gets profound data for the area. The first concept seems to perform better because the affected area is smaller. But as it is visible in, the runoff in the east gets slowed down by the green space in front of the houses. That means that the buildings are not harmed by the debris. By contrast, in the first proposal, the overall area at risk is less but the buildings that are affected are hit directly by the fast runoff.
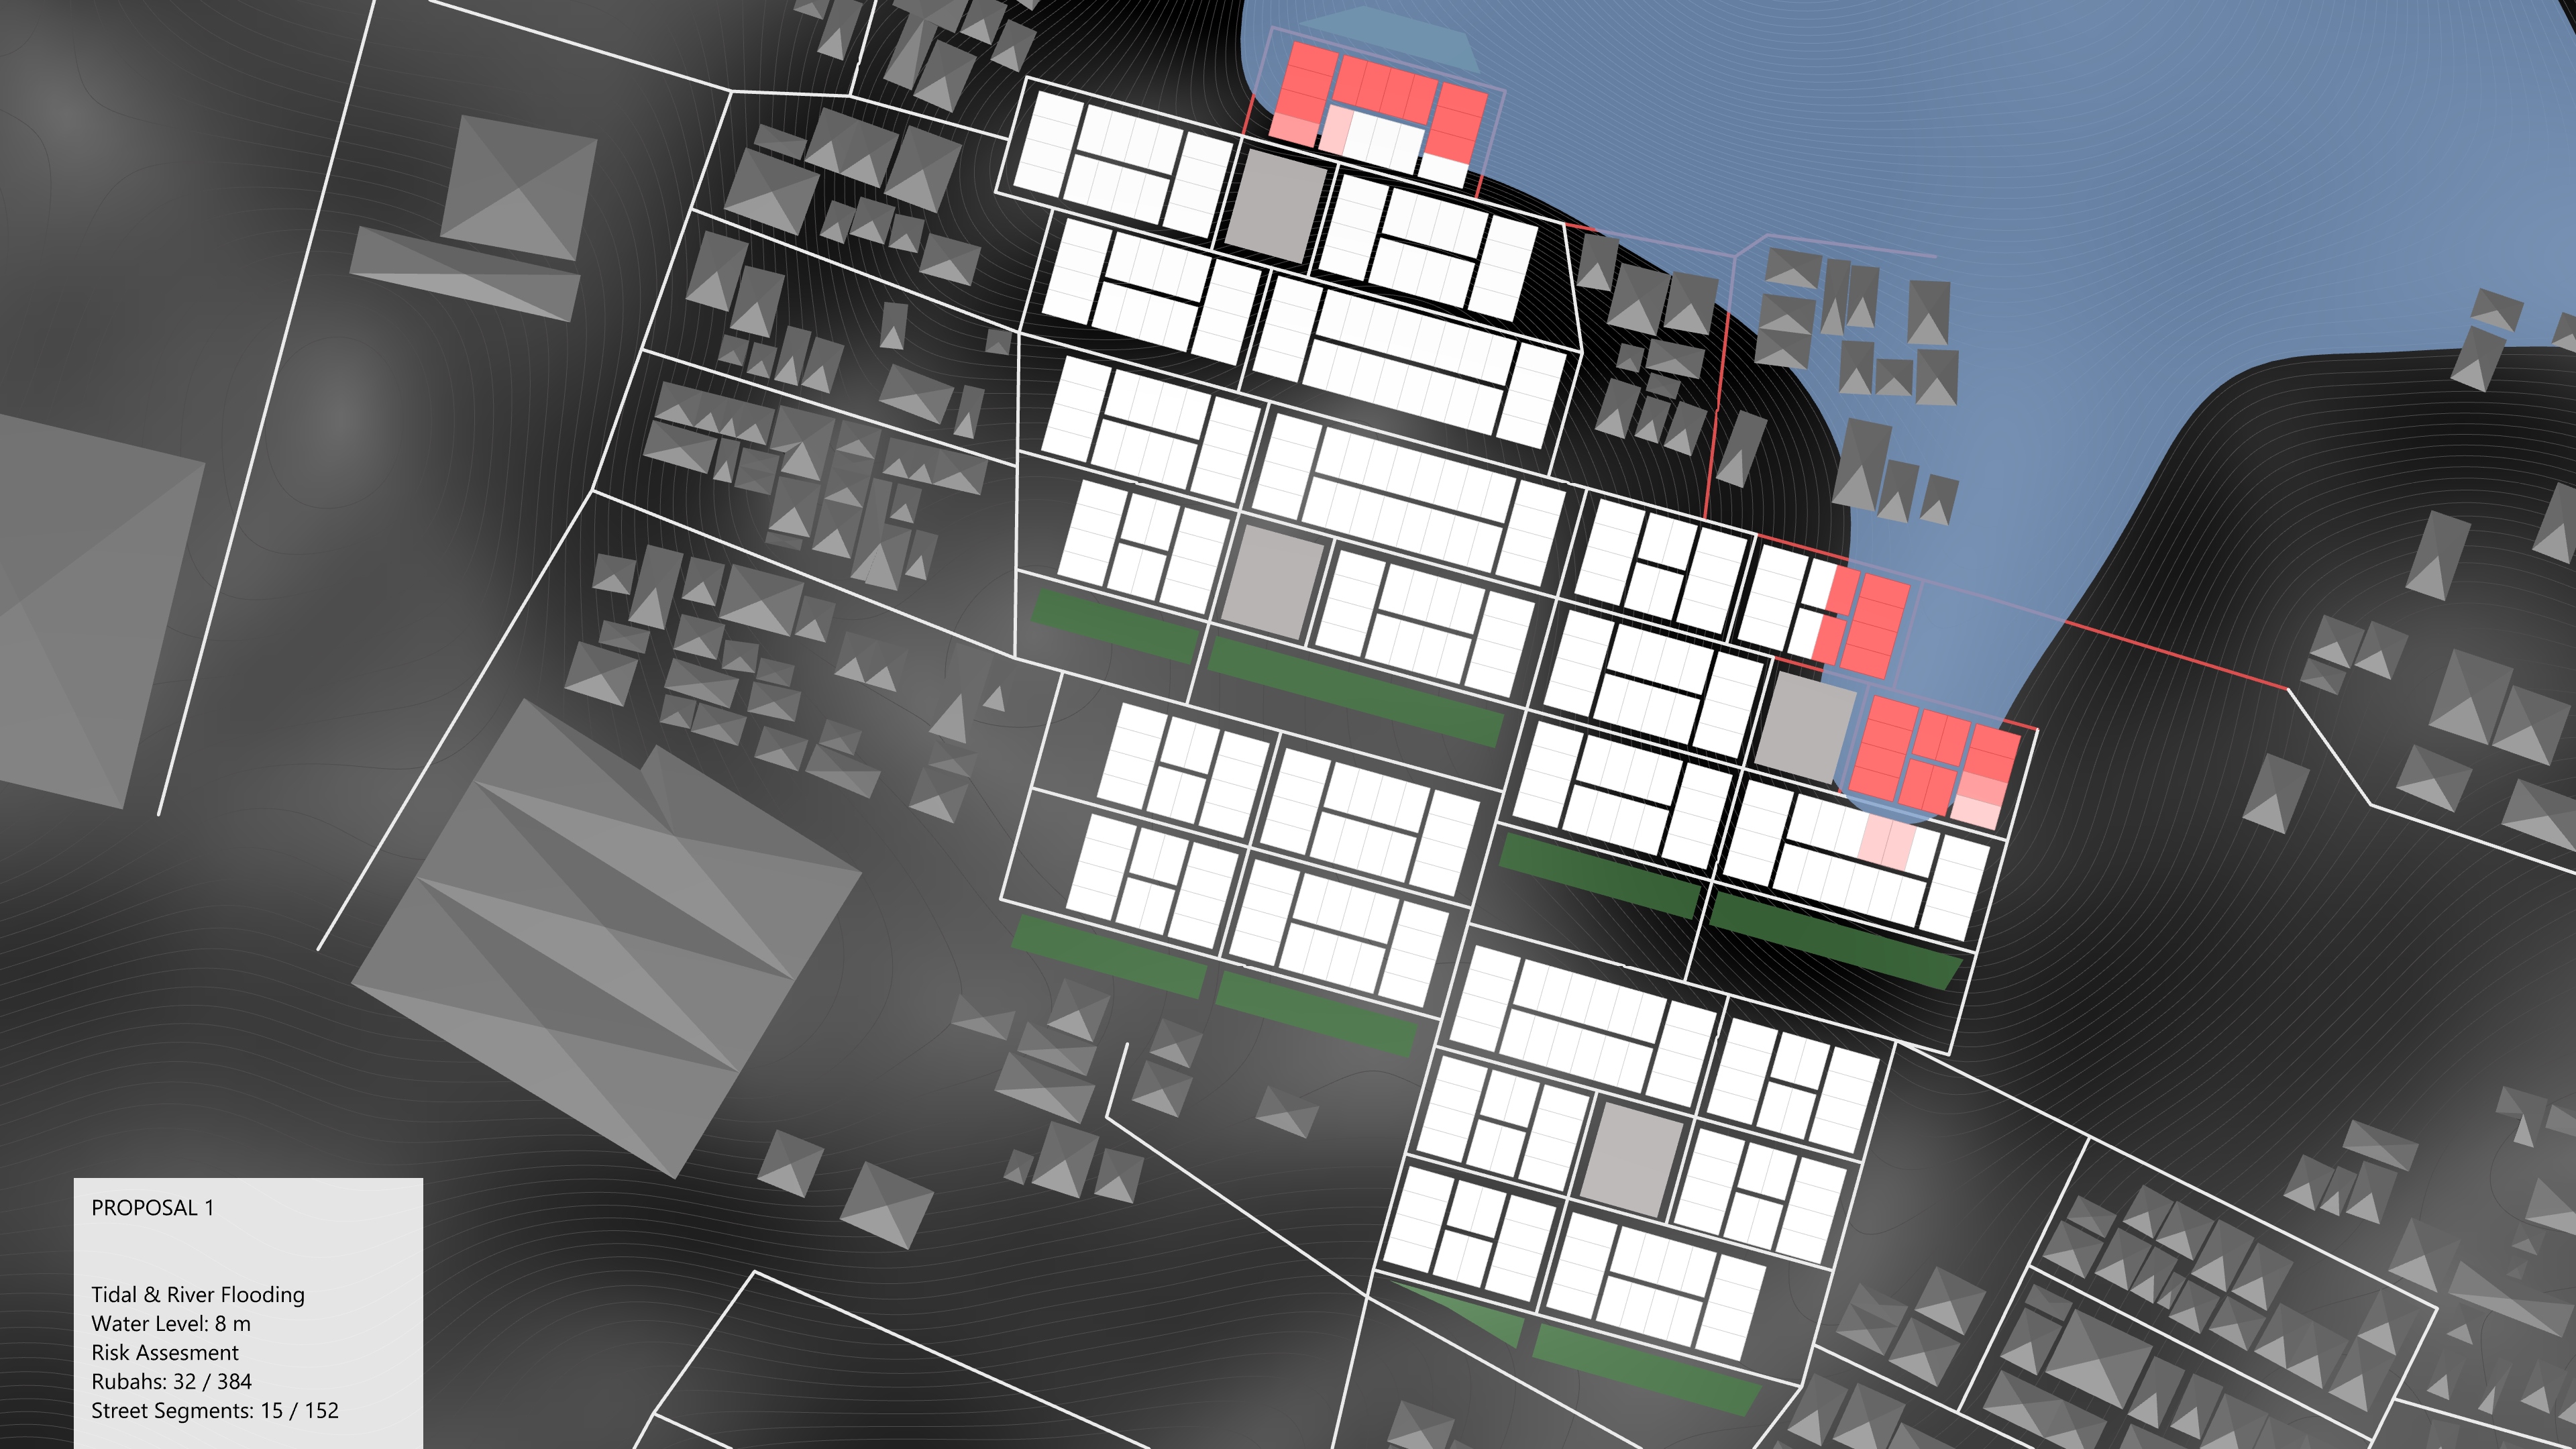

TIDA & RIVER FLOODING – RISK EVALUATION
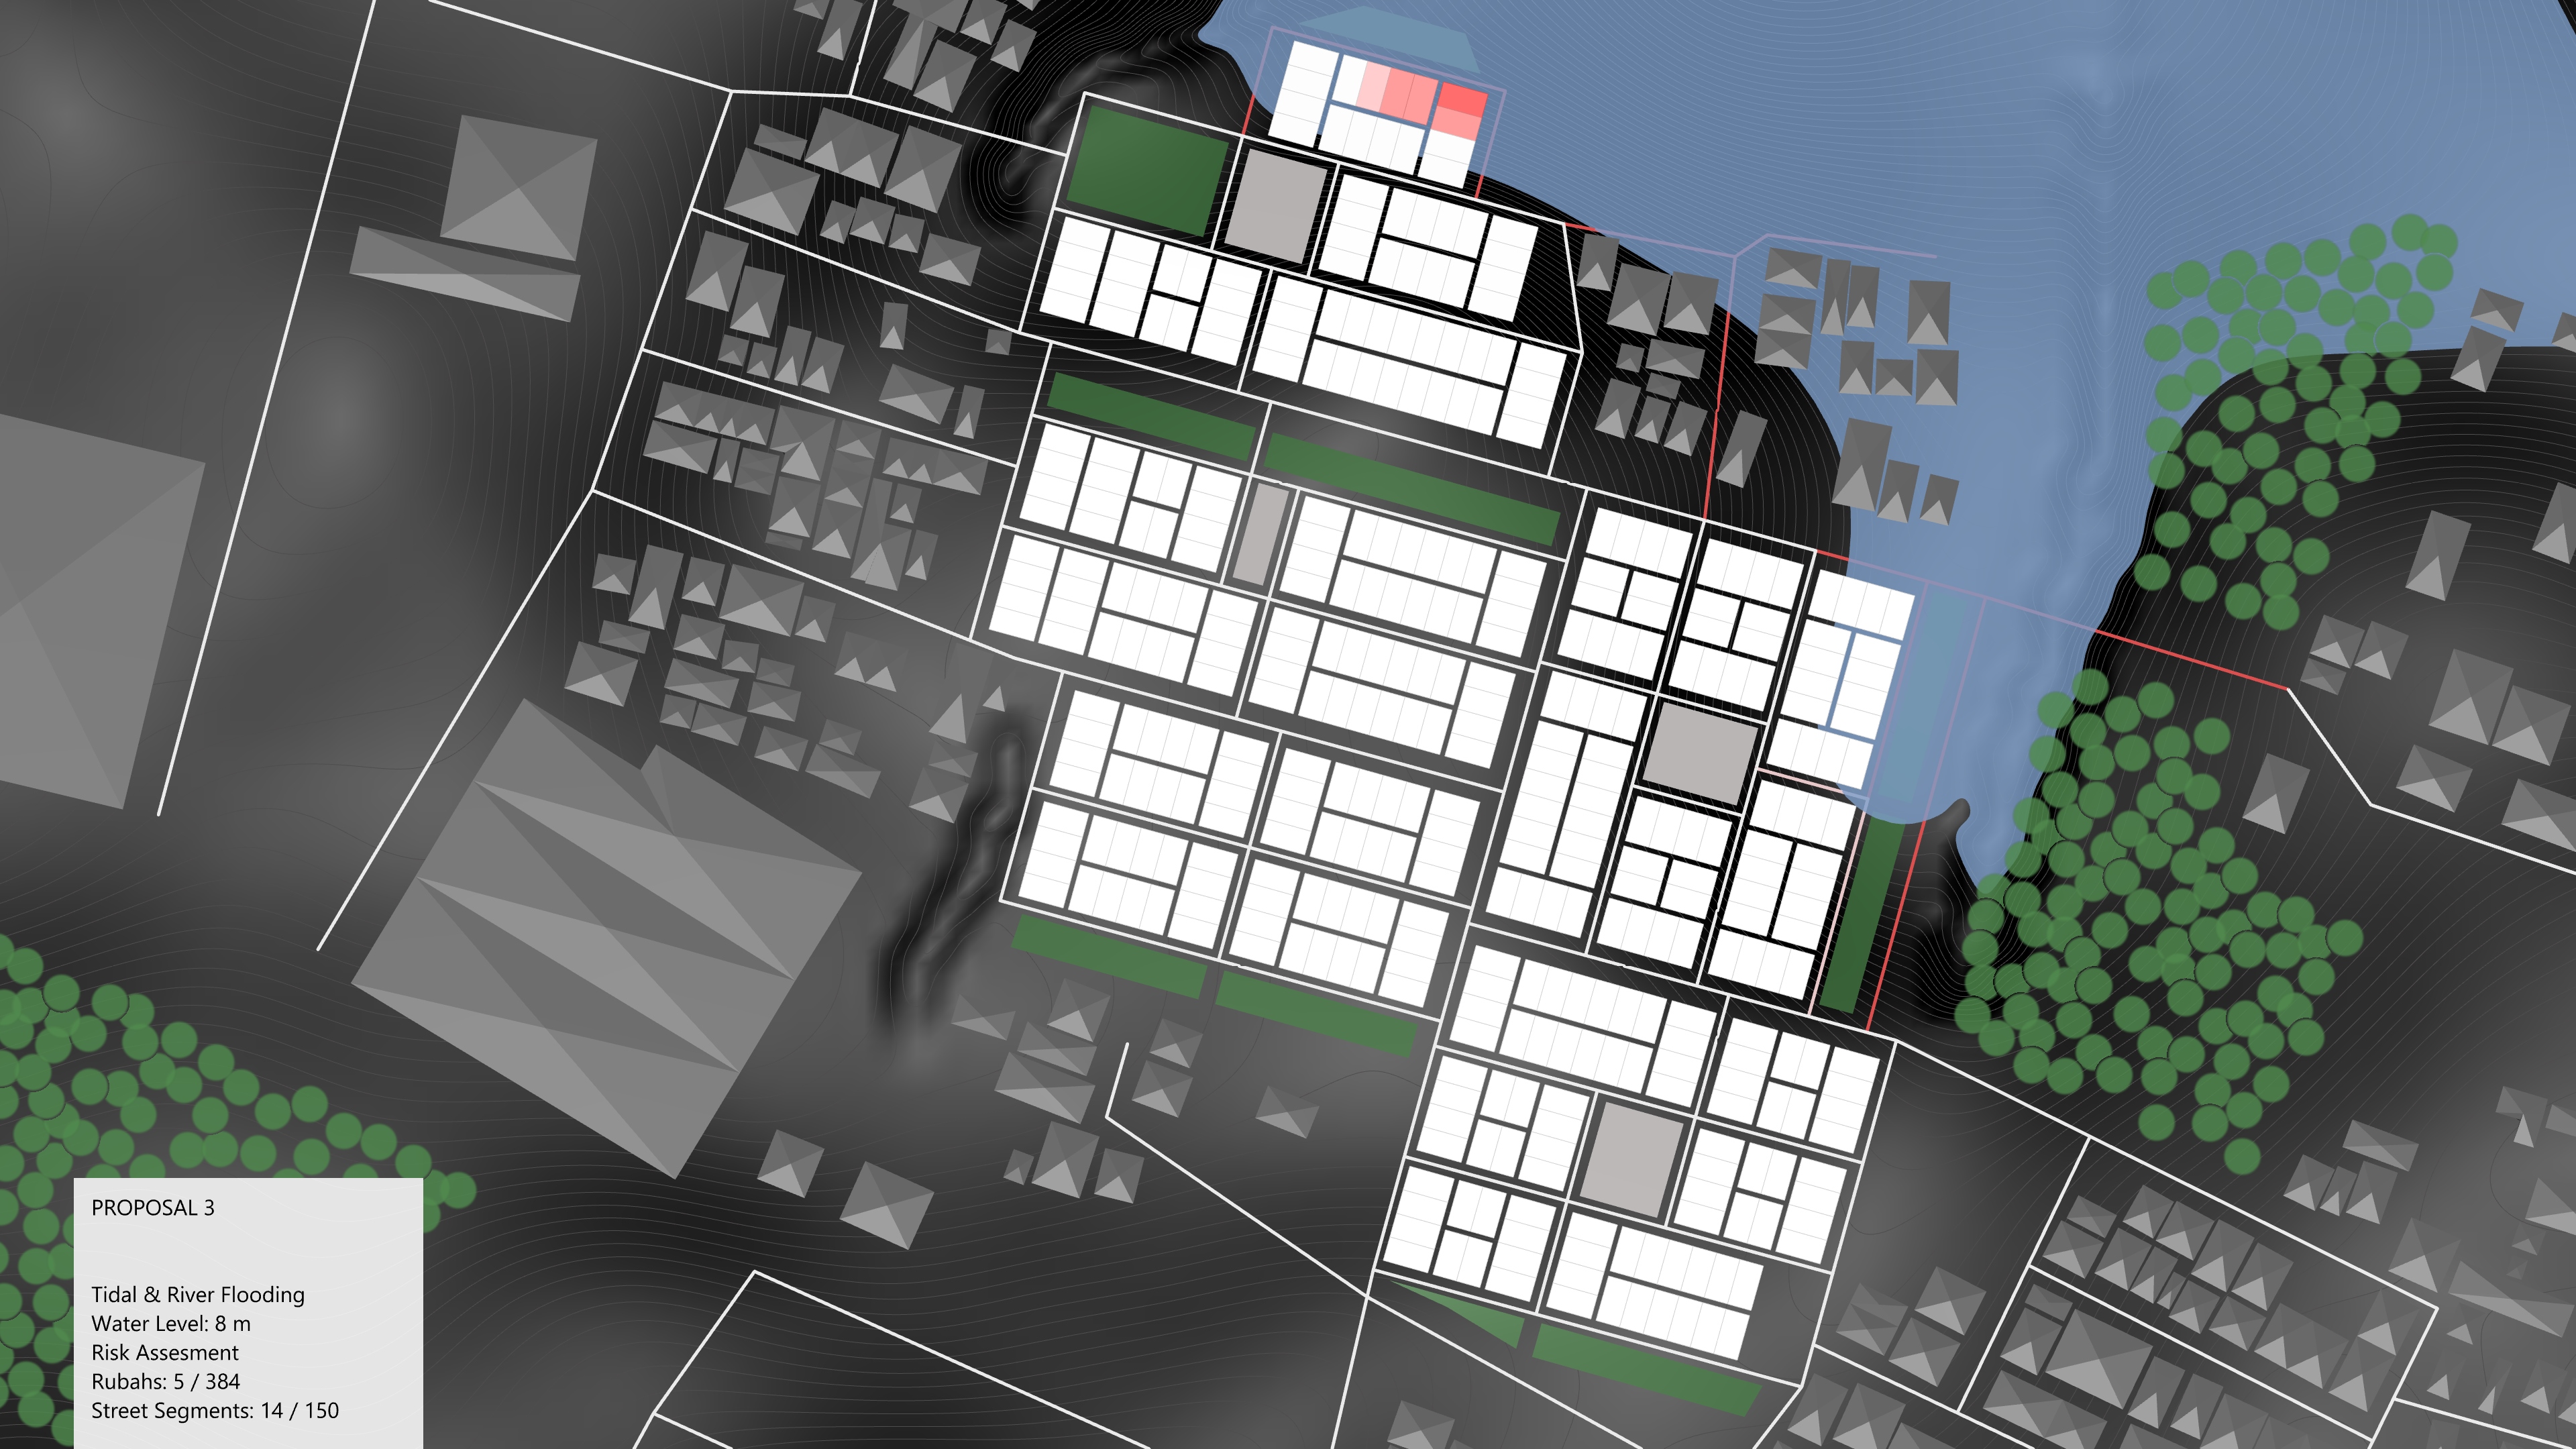
The figures above depict the outcome of the tidal & river flooding simulation. The legend in the left bottom corner states, that the first concept hosts its housing units in a way that during a high tide of 8 meters, there are 32 buildings flooded. At the same water level, there are only 25 buildings at stake in the second concept. This means that 7 homes can be saved from severe damages due to flooding by changing the spatial layout.
During the simulation, the risk assessment for the houses and the street network is presented. When the water level reaches the top of a platform of a building, it is marked with a red color. The toolbox applies a darker tone of red according to the depth of water. The depth is computed by iteration so each frame represents a depth of eight centimeters. It counts the number of iterations after a building is considered as flooded. In this case, the water levels that are deeper than 24 centimeters are considered equal. The values can be adjusted as needed. For this case study, the value is set to balance imprecisions and to match the threshold of lasting damages. The same methodology for assessing the risk applies to the city network. Hereby the lowest point of the street segment is evaluated. When the water reaches it, it is marked with a red color in the same manner as the risk assessment for the buildings.
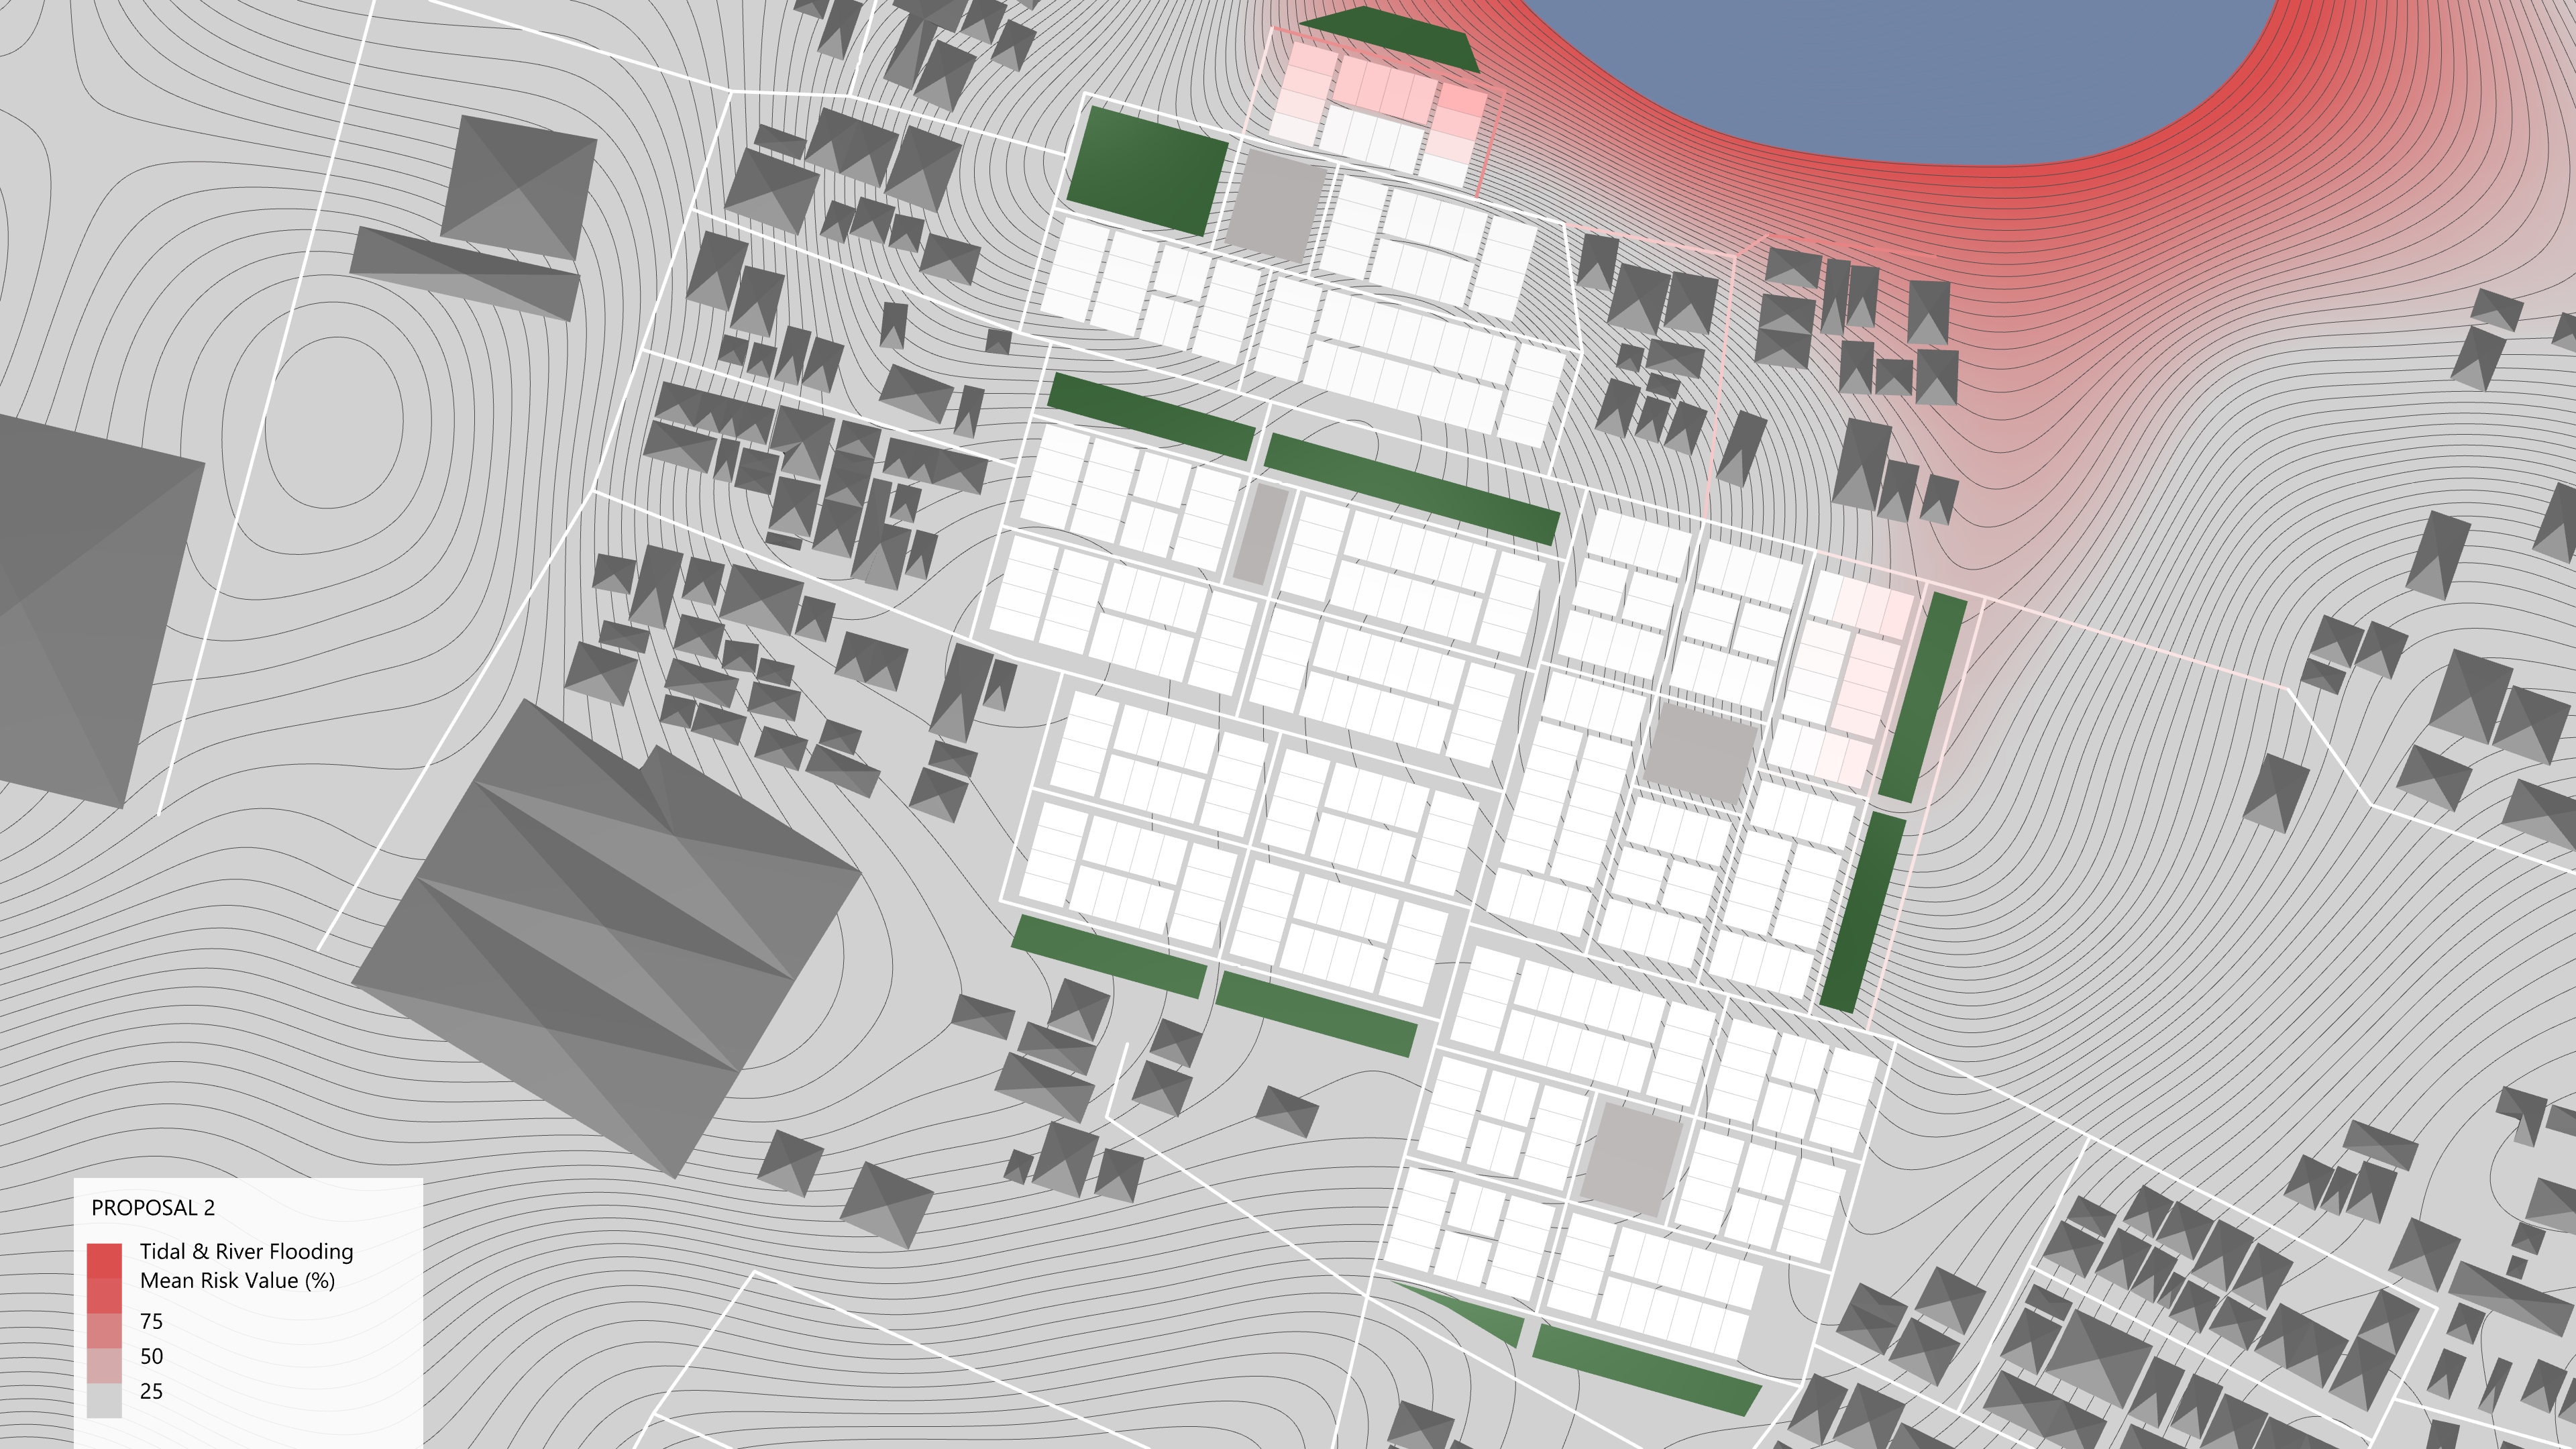

TIDA & RIVER FLOODING – MEAN RISK ASSESSMENT
The last part of the evaluation phase is called the mean risk assessment. It is related to the tidal and river flooding simulation and gives an understanding of the risk distribution in the area. Whereas the prior evaluation is useful for evaluating the site for specific water levels, the mean risk assessment shows the risk of all scenarios combined. In this case, every single state of the tidal and river flooding simulation is recorded to compute the mean value. The toolbox then colors all affected buildings and street segments according to its mean associated risk from low to high.
The mean risk assessment provides useful information about locations that are not endangered by flooding and therefore suitable for e.g. housing units. Alongside comes the ability to divide a plot into parcels with different functions. For example, locations with a high risk of inundation are not suitable for housing or commercial estates but rather can be used for green spaces or public spaces with mobile structures such as markets.


WORKING WITH THE SRTF
Based on the evaluation of the two proposals, we prepared a third concept with minimal interventions. The result is proposal 3 and can be seen in the figure above. Now there are three ditches aligned downwards to control the runoff. Two are located in those areas where there were strong accumulations visible in the rain runoff inundation evaluation of proposal 2. One is in the north and one is in the eastern part of the region. Both ditches were trenched into the ground and both reach down to the shoreline. The third ditch is situated at the western border of the third district. Besides that, there is now a bridge over the ditch, connecting the second district with the surroundings. The third measurement is forestation in those areas where the risk of erosion is particularly high. The trees are illustrated as green dots in the viewport. Lastly, we elevated the living quarters of the Rubahs that are affected by tidal and river flooding.
The significant change of the rain runoff inundation evaluation is the reduction of affected Rubahs by more than 50 percent. The rain runoff erosion evaluation shows significant changes as well. Due to forestation, the endangered area is decreased to 0.38 hectares. Regarding the tidal and river evaluation, the third proposal performs better as well. The number of homes vulnerable to flooding decreased by 20. The legend of figure 21 states, that there are still two Rubahs in the north with a mean risk value of over 50 percent.
Download the Rhino3D/Grasshopper Source Files
Please enter a password to see the content: