Evolving Configurational Properties

Evolving Configurational Properties

article published at 12th Space Syntax Symposium at Jiaotong University, Beijing, China

SIMULATING MULTIPLIER EFFECTS BETWEEN LAND USE AND MOVEMENT PATTERNS


Martin Bielik 1, Reinhard Koenig2,3 , Ekaterina Fuchkina1, Sven Schneider1, Abdulmalik Abdulmawla1

1 Bauhaus University, Weimar, Computer Science in Architecture
2 Bauhaus University, Weimar,  Computational Architecture
3 Digital Resilient Cities, Austrian Institute of Technology

Abstract

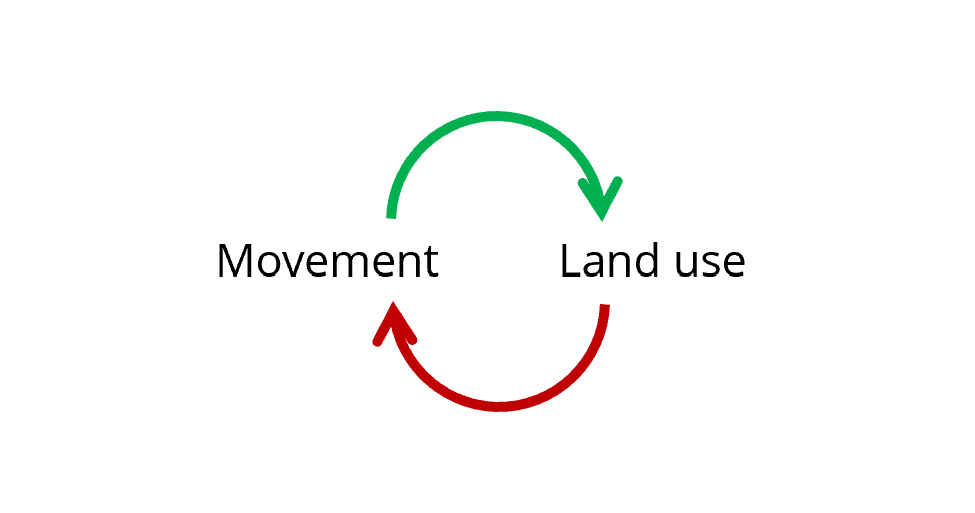
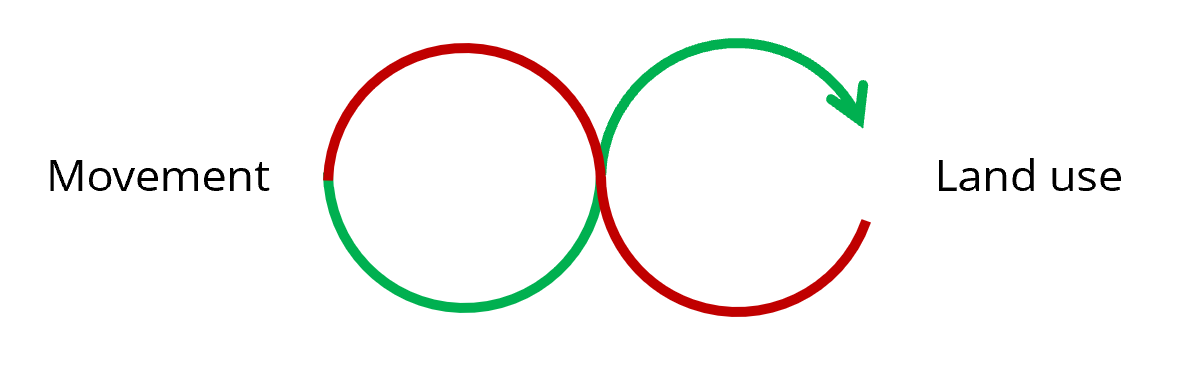
In this paper, we introduce simulation framework for examining the effect of street network configuration on the evolution of the relationship between movement and land use allocation over time. The causal chain introduced in Space Syntax literature suggests that the potential generated by spatial configuration of a street network influences how people move and that these movement flows attract specific types of land uses. These land uses generate in turn additional movement creating an endless cycle of mutual interactions. In Space Syntax, this interaction between movement flow and land use is assumed to work in a positive feedback loop, multiplying the initial potentials given by a street network configuration. The practical consequence of this hypothetical assumption for the Space Syntax method is that the outcome of the feedback loop can be predicted as multiplication of the initial state and therefore doesn’t have to be simulated.
In this paper, we introduce a computational method for testing the multiplier effect hypothesis and identify the cases in which it holds true and those ones in which more detailed investigation considering feedback loops might be necessary. We demonstrate how such investigation based on the simulation of the interactions between movement and land use in time can be operationalized and conduct series of studies exploring the spatio-temporal effects of street network configuration.
We conclude that these exemplary studies show how the presented simulation model can be used to test the core assumption behind the Space Syntax method. We also offer preliminary insides about when and under which conditions it can be reliably applied and when system dynamic simulation might be necessary to predict not only the immediate, but also the long-term effects of street network configurations on centrality, movement and land use distribution.

Keywords

Street network configuration, System dynamics, Centrality, Movement, Land use, Multiplier effects, Natural movement


One sentence summary:

We explore the evolution of the configurational effects of urban form on the movement and land use allocation over time.

Paper overview

In this section, we compiled a short review of the main ideas discussed in the paper. The purpose is to get a general idea that can be deepened by reading the full paper attached below.

1. Background | What do we already know?

A)

“Street network configuration affects how people move”


(Golledge 1995)
B)

“Street network configuration affects where human activities allocate”

(Hansen 1959)
C)

“Movement influences allocation of land uses and allocation of land uses influence movement”

(Hillier 1996a)

D)

“Space Syntax is about bringing the configuration, movement and allocation of activities together”

(Hillier 1996b)

2. Research gap | What do we don’t know?

“Does the effect of street network configuration on movement and land use allocation evolve over time?”

OPTION A)

“The effect of configuration on movement and land use is stable over time, it DOES NOT EVOLVE

OPTION B)

“The effect of configuration on movement and land use does DOES EVOLVE over time”

Consequences

A) = SIMPLE TO PREDICT

B) = HARD TO PREDICT


Source: http://labs.minutelabs.io/Chaotic-Planets

3. Research question | What do we want to know?

Question A

Under which conditions is the result of the feedback loop between movement and land use distribution predictable as a function of the multiplier effect?


Question B

Under which conditions does the natural movement potential of the network configuration correct the effect of unequal distribution of land uses (disruptions) throughout the feedback cycle?


“Space Syntax method is based on the assumption that option A holds true. In other words, it is assumed that the outcome of the interaction between land use and movement can be predicted without simulation.”

This assumption is based on:

1. Multiplier effect hypothesis

The result of the feedback loop between movement and land use distribution is predictable as a function of the multiplier effect

(Hillier 1996b)
2. Natural movement hypothesis

The natural movement potential of the network configuration corrects the effect of unequal distribution of land uses (disruptions) throughout the feedback cycle

(Hillier 1999)

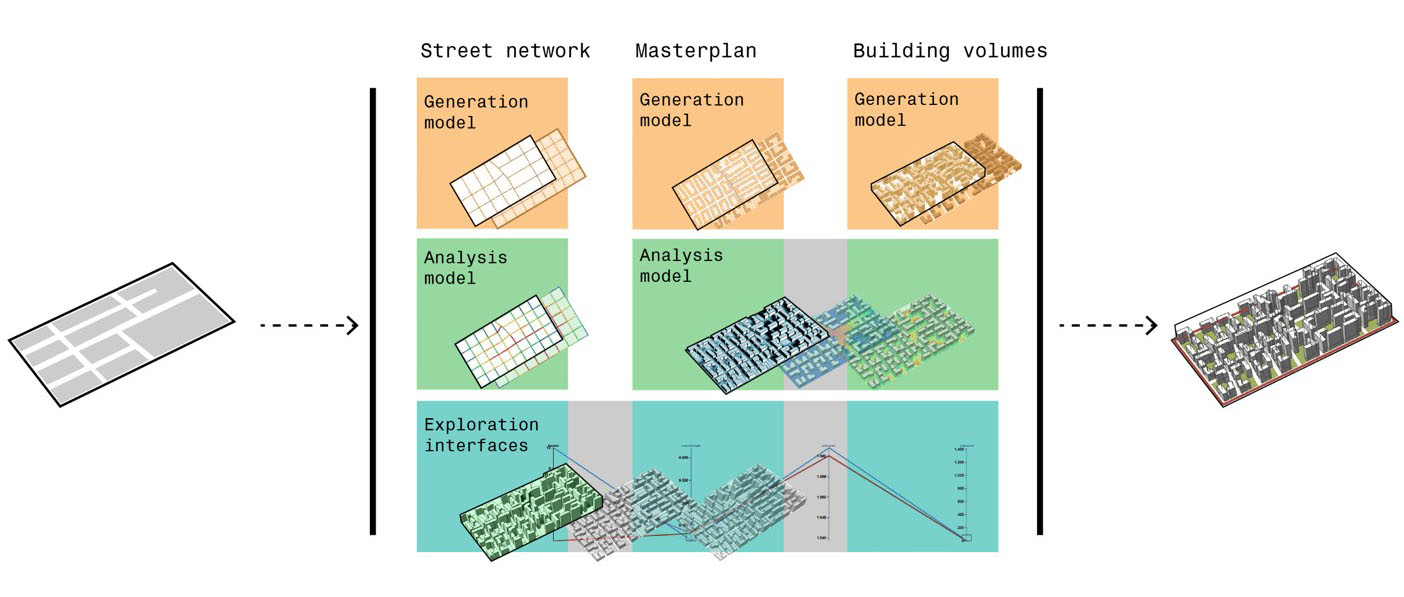
4. Research method | Spatio-temporal simulation engine

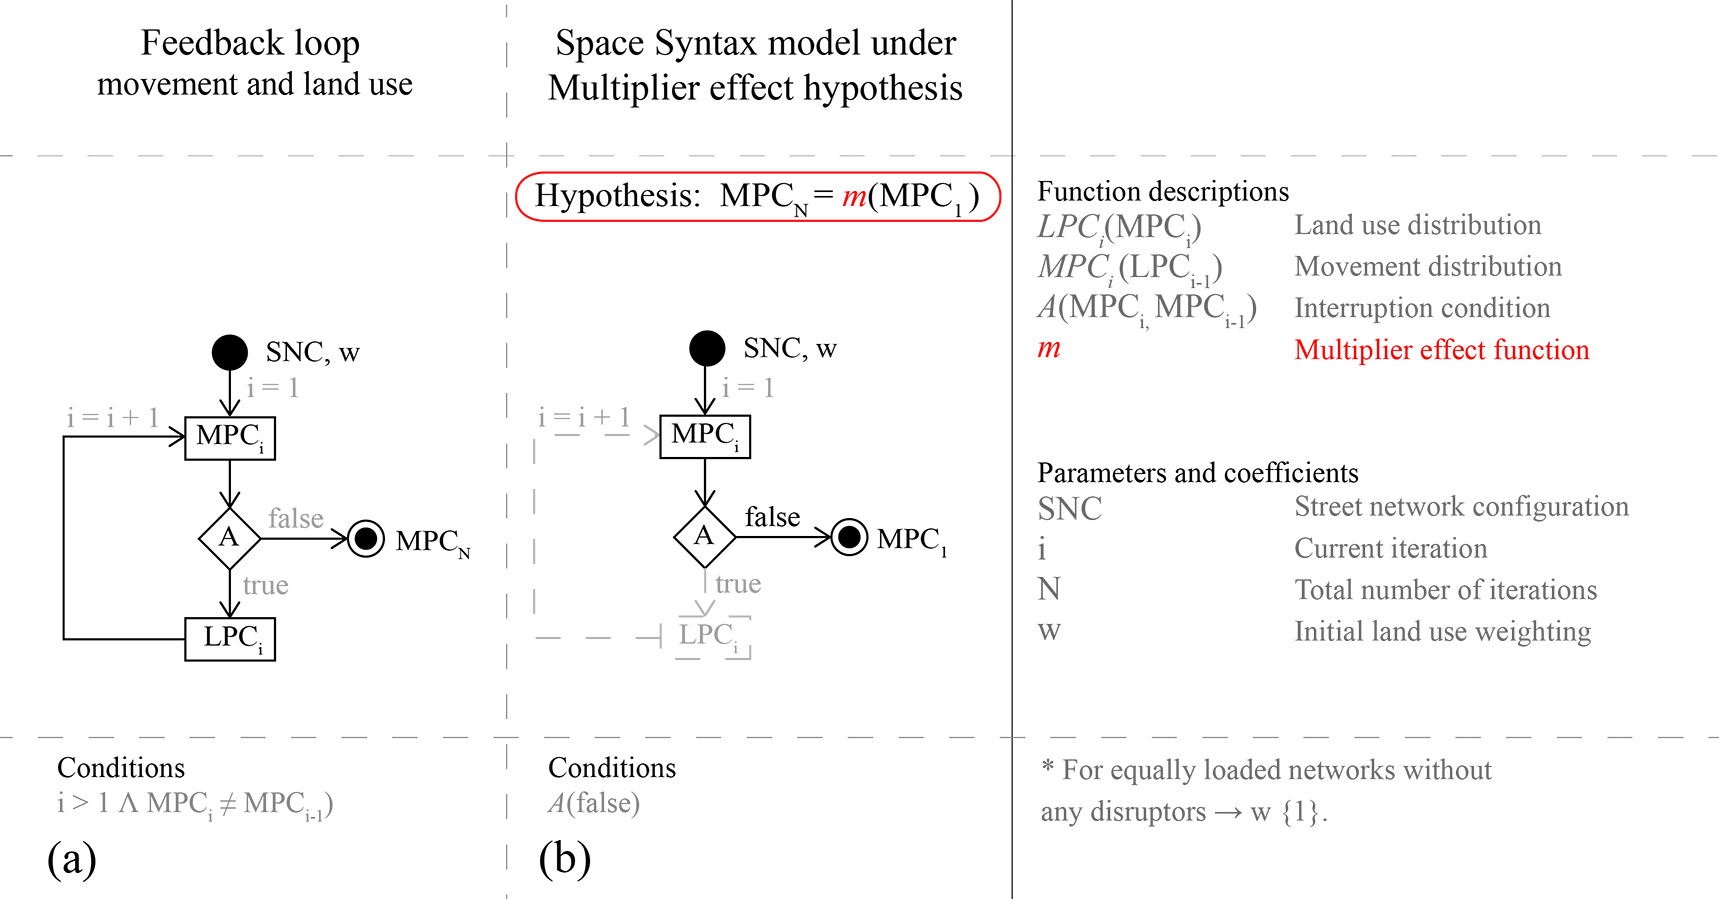
Left ) UML diagram of the Space Syntax underlying urban dynamics model. a) current model of the feedback loop between movement and land use. b) displays the “multiplier effect” hypothesis.
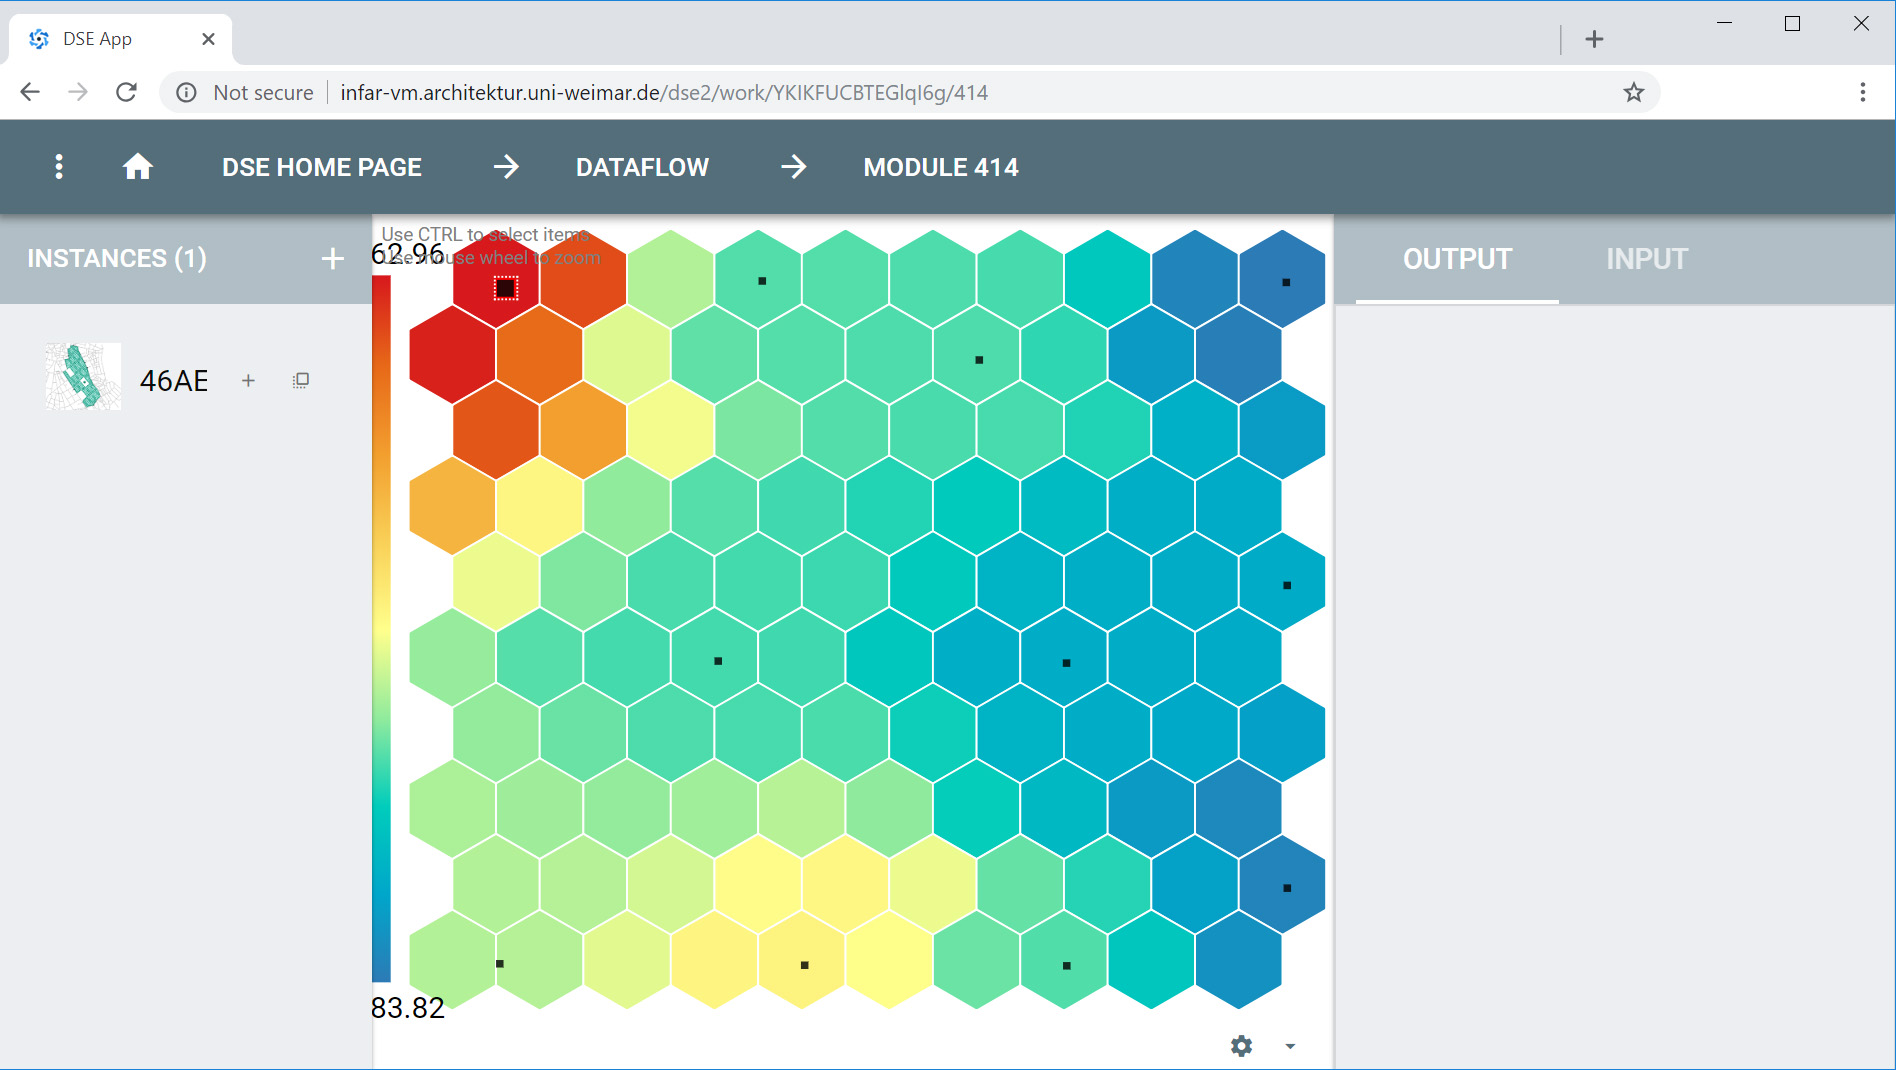
Right) Exemplary illustration of two iterations of our dynamic simulation. The initial state is an equally loaded network. The centrality values show the angular betweenness centrality with radius Rn (global radius).Value range: high movement potential = red, low movement potential  = blue

5. Results | Simulation experiments

We exemplary explore the impact of different conditions on the multiplier and natural movement effect. The conditions explored in this study relates to how we model the effect of land use on movement and what is the initial distribution of land use in the simulation.

Explored conditions & model parameters:

  • Definitions of movement potential centrality MPC.
    Closeness vs. Betweenness centrality
  • Analysis radius
    Local radius of 600m vs. global radius
  • Initial land use weightings w
    Equally loaded vs. Disrupted network*

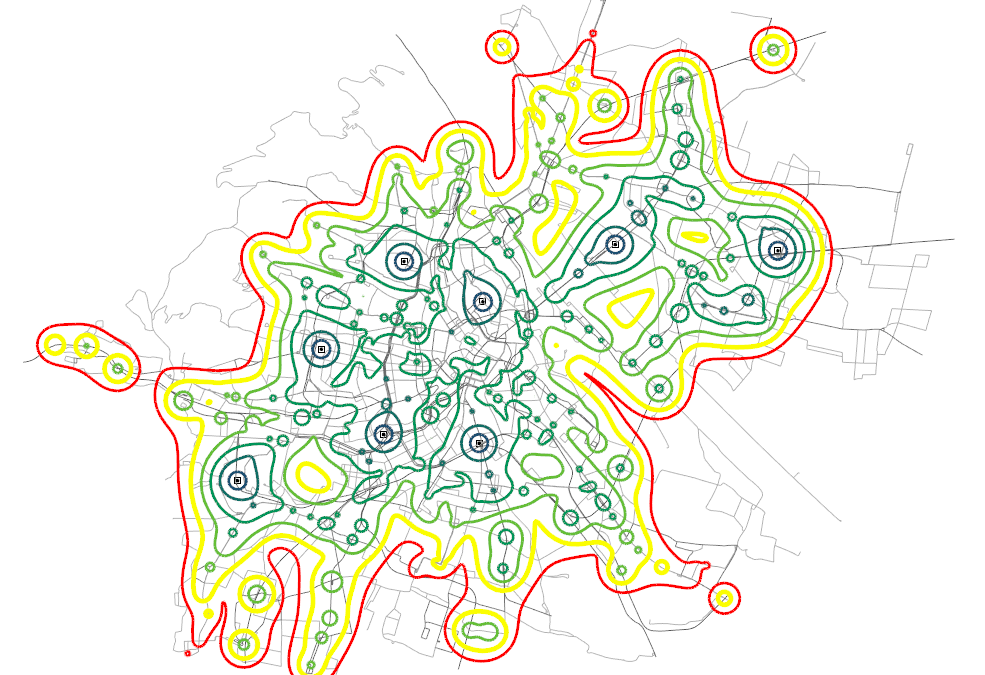
For the following experiments, we used the street network of the inner city of Weimar as an exemplary case study area. Weimar is a medieval, mid-size German city with approximately 60.000 inhabitants. The size, historical development and the overall variety of street network patterns makes it a good candidate for testing the proposed simulation model. On the one hand, the size of the city makes it possible to quickly calculate many iterations of the simulation, but on the other hand it is large and diverse enough to let non-trivial configurational patterns emerge.

*Disrupted network in context of this paper means that in the initial stage of the simulation, not all street are loaded with equal amount of land use. In other words some streets produce more movement than others, which is represented by higher weighting of selected graph vertices.

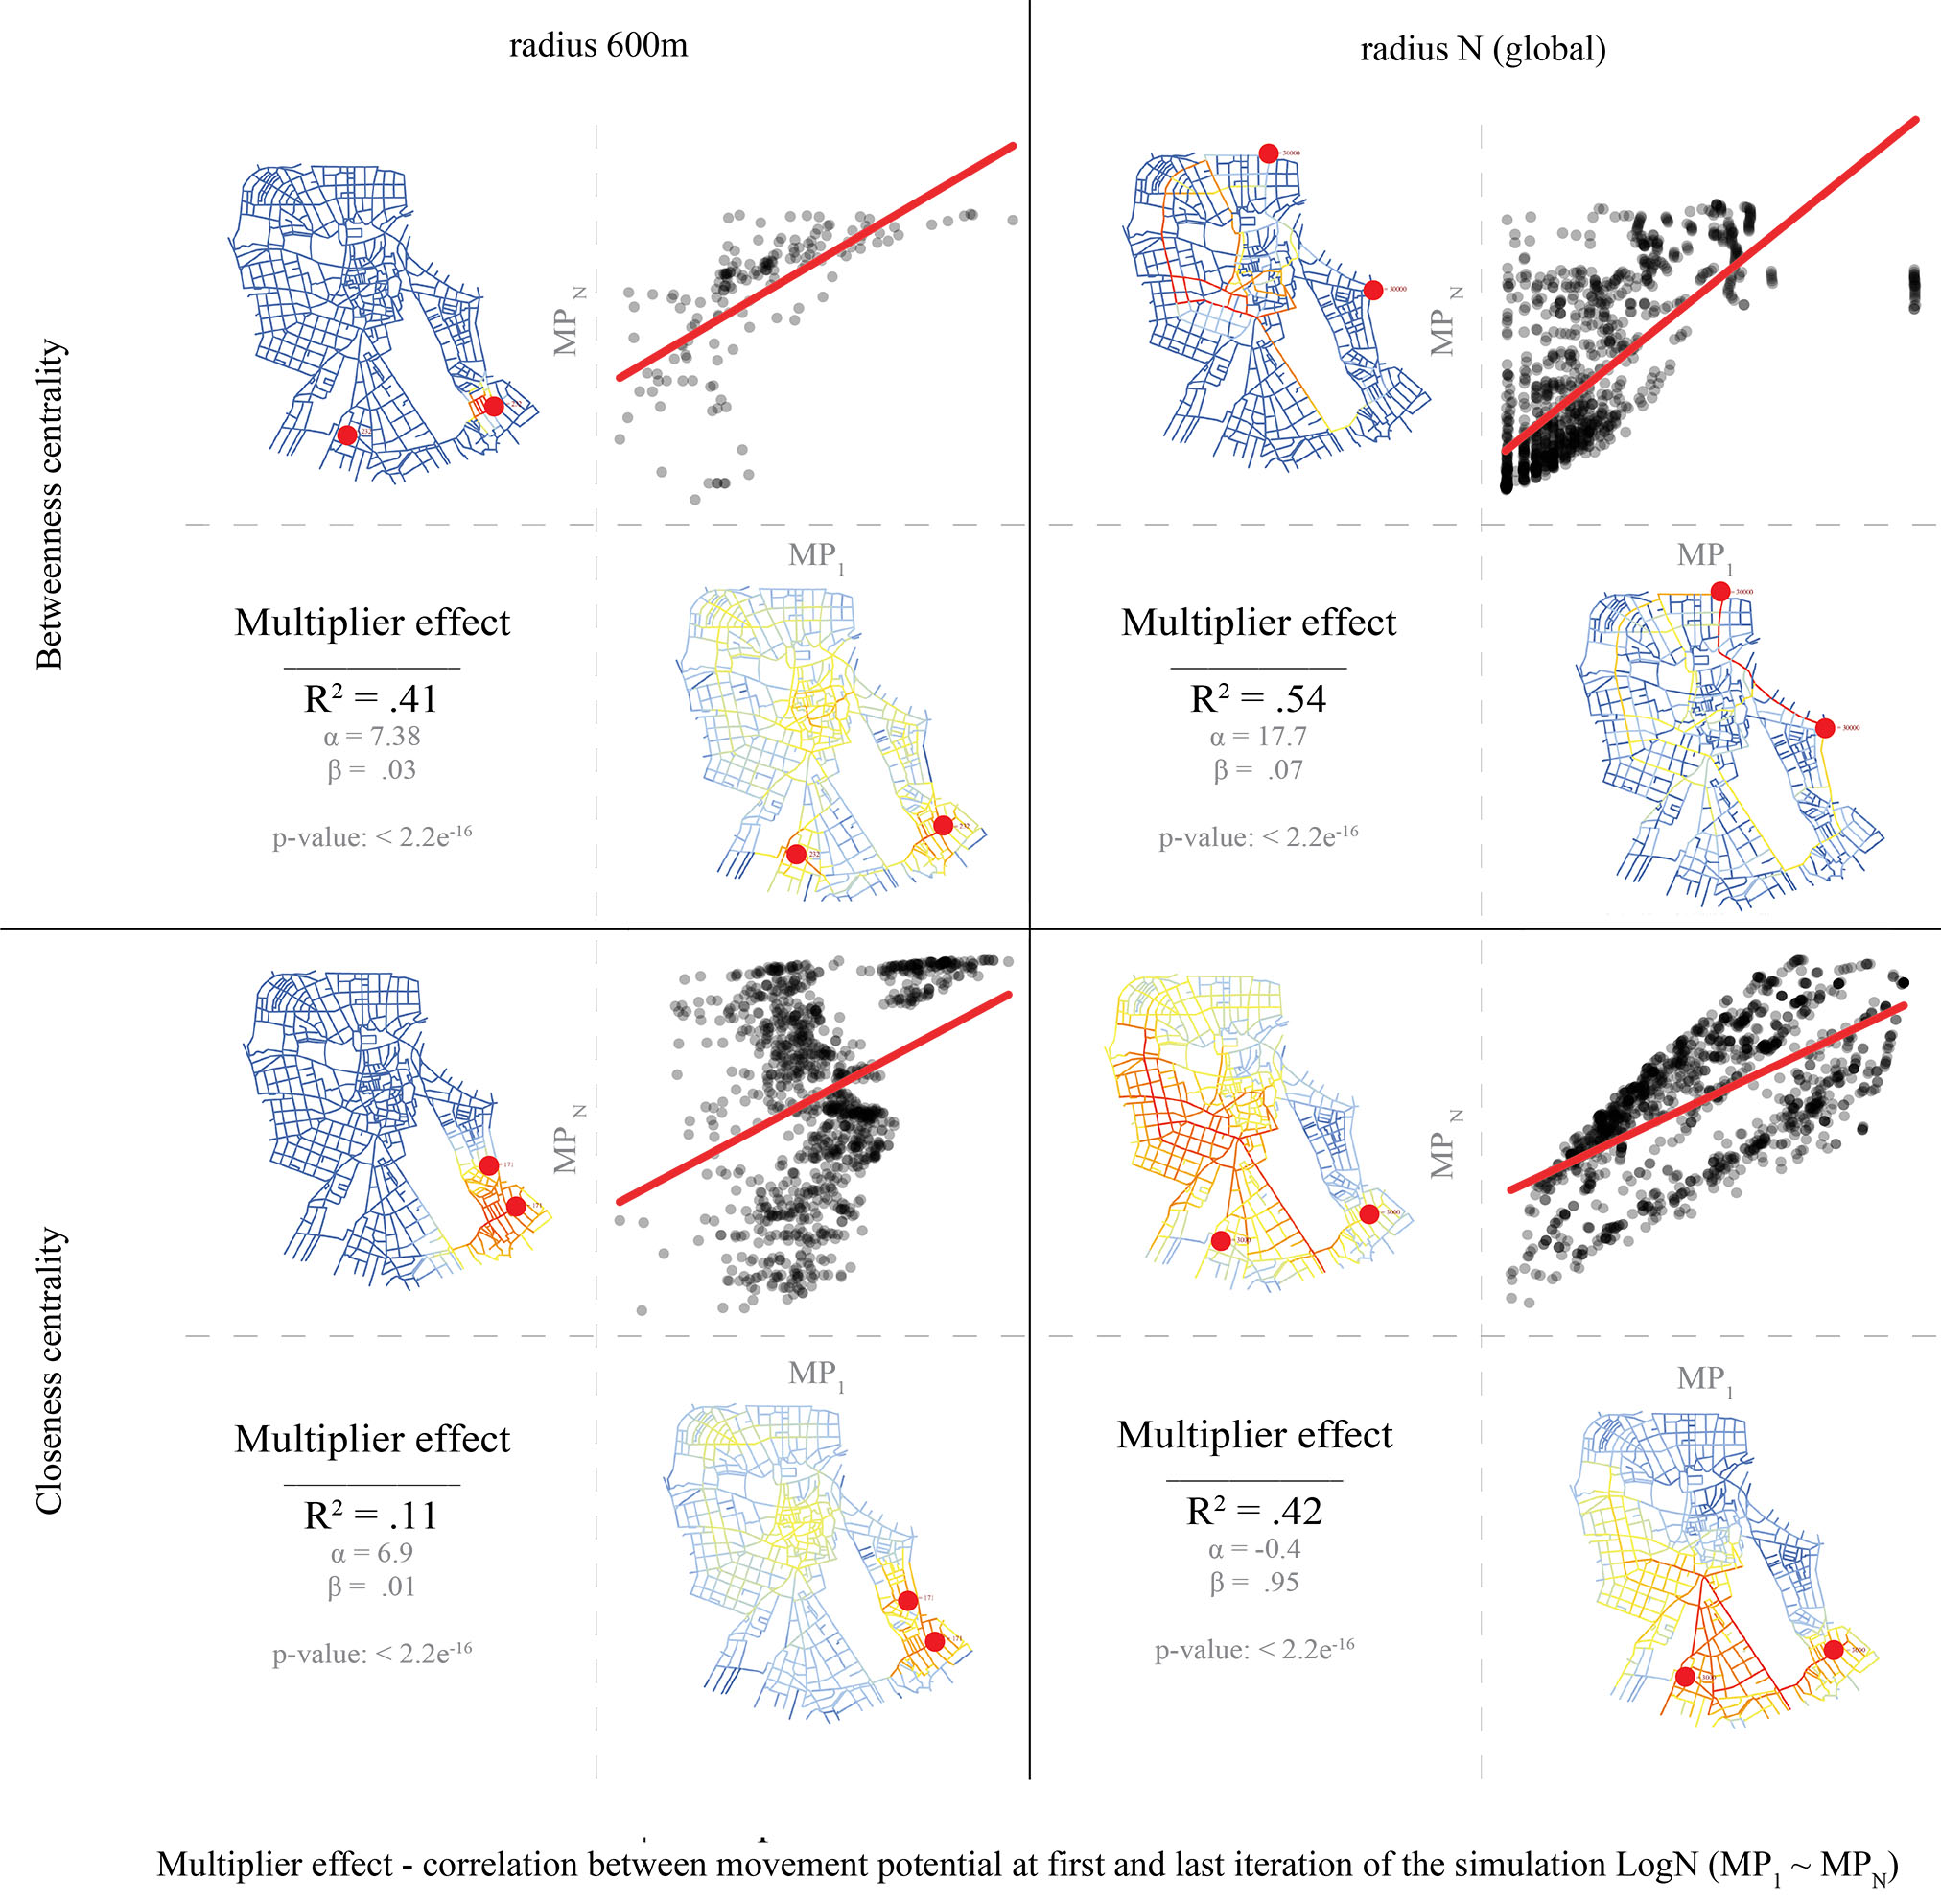
Experiment 1 | Measuring the multiplier effects  on equally loaded network

Equally loaded network in context of this paper means that in the initial stage of the simulation, all street are loaded with equal amount of land use. In other words all streets produce same amount of movement, which is represented by equal weighting of all graph vertices.

E.1a

Conditions:

  • Equally loaded network
  • Betweenness centrality
  • Global radius
E.1c

Conditions:

  • Equally loaded network
  • Betweenness centrality
  • Local radius
E.1b

Conditions:

  • Equally loaded network
  • Closeness centrality
  • Global radius
E.1d

Conditions:

  • Equally loaded network
  • Closeness centrality
  • Local radius

Experiment 1 | Summary

Quantifying the multiplier effect by measuring linear relationship between the movement pattern at the first and the last iteration of the simulation


  • Multiplier effect is reliable predictor for:
    i) global closeness centrality
    ii) global betweenness centrality
  • Strong effect of scale of the centrality model
    Multiplier effect Global > Multiplier effect Local

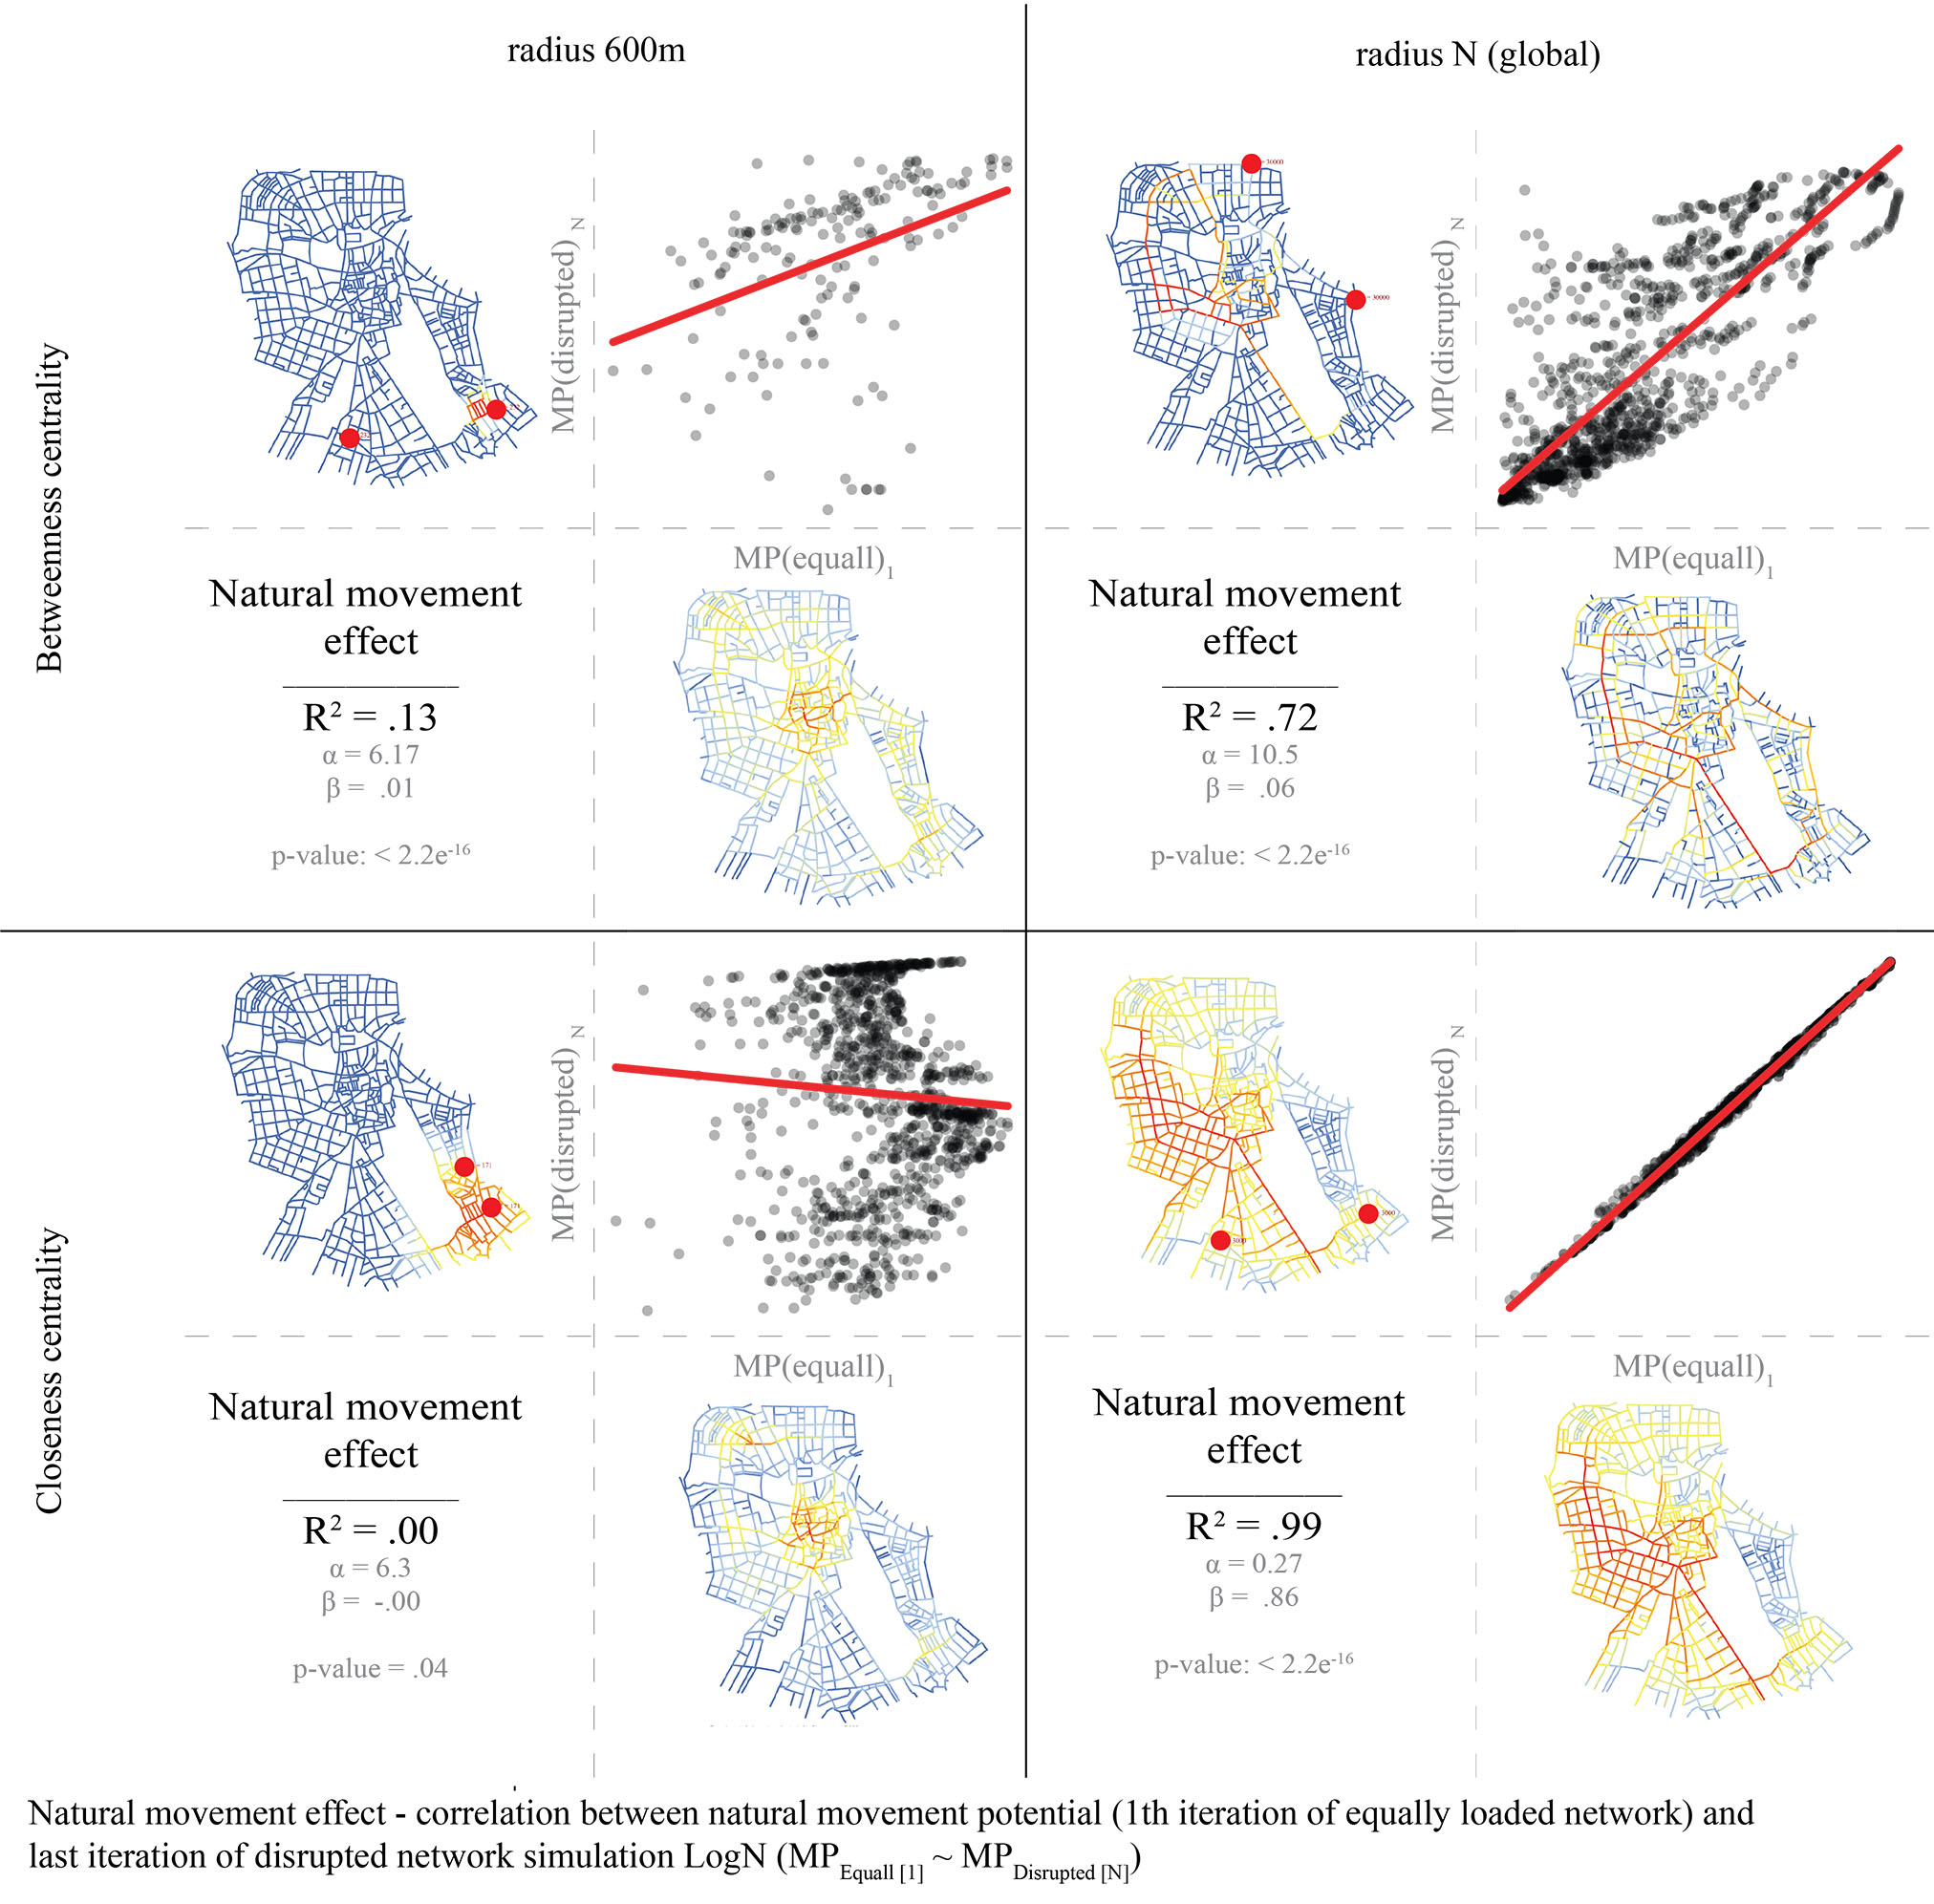
Experiment 2 | Measuring the multiplier effects on disrupted network

Disrupted network in context of this paper means that in the initial stage of the simulation, not all street are loaded with equal amount of land use. In other words some streets produce more movement than others, which is represented by higher weighting of selected graph vertices.

E.2a

Conditions:

  • Disrupted network
  • Betweenness centrality
  • Global radius
E.2c

Conditions:

  • Disrupted network
  • Betweenness centrality
  • Local radius
E.2b

Conditions:

  • Disrupted network
  • Closeness centrality
  • Global radius
E.2d

Conditions:

  • Disrupted network
  • Closeness centrality
  • Local radius

Experiment 2 | Summary

Quantifying the multiplier effect by measuring linear relationship between the movement pattern at the first and the last iteration of the simulation


  • Multiplier effect is NOT reliable predictor
  • Doesn’t pick up most central streets*.* Non normality & heterocsedascity

Experiment 1&2 | Measuring the natural movement effect

Quantifying the natural movement effect by measuring linear relationship between the movement pattern at the first iteration of equally loaded network and last iteration of the disrupted network.


  • Natural movement is reliable predictor for:
    i) global closeness centrality

6. Conclusions | Joined multiplier and natural movement effect

Evaluating the impact of scale, initial network loading, and type of centrality measure on natural movement and multiplier effect. In other words, under which conditions is the influence of configuration on movement predictable without simulations and when the simulation is needed.


NO SIMULATION IS NEEDED:

  • For global closeness and betweenness centrality in equally loaded networks
  • For global closeness and in disrupted networks

SIMULATION IS REQUIRED:

  • When running local models
  • When running models on disrupted – non equally loaded networks

7. Outlook | Next steps

A) Testing the simulation results against empirical longitudinal data

B) Testing the sensitivity of multiplier and natural movement effect on conditions related to street network configuration and type of land use (i.e. does multiplier effect depends on the type of the street network layout and how we model the impact of movement on land use).


Download the article

Bielik et al. – 2019 – Evolving configurational properties.pdf


Cite the article

Bielik, M., Koenig, R., Fuchkina, E., Schneider, S., & Abdulmalik, A. (2019). EVOLVING CONFIGURATIONAL PROPERTIES – Simulating multiplier effects between land use and movement patterns. Presented at the 12th Space Syntax Symposium, Beijing, China.
 

Supplementary materials


Grasshopper scripts

Following grasshopper script  simulates the interaction between movement flows and land use distribution through street network configuration. The street network used in the example is simplified example of city of Weimar, Germany which was used as an example in the paper. The data for the street network is directly embedded in this script.

Versions of the script:

1. Simplified script, easy to run. This script requires only DeCodingSpaces toolbox and Anemone plugins being installed (see instructions bellow)
evolving configurational properties_simple.gh

2. Full script. This script requires also R language additionally to DeCodingSpaces toolbox and Anemone plugins being installed (see instructions bellow). This version of the script offers some additional visualization and possibility to save the simulation results
evolving configurational properties_full.gh


NOTE: Get sure the GPU acceleration is enabled.
(otherwise is the simulation too slow to execute in real time)
NOTE: Check the requirements section bellow and get sure you get all the plugins installed using the links on this website.(otherwise the version might not fit the version of the script)


Requirements

Install instructions

Unblocking plugins

After downloading the RequiredGHPlugins_SimAUD19.zip file, check if its unblocked before extracting the zip archive. Right click on the file > Properties > select unblock > select ok

Install components

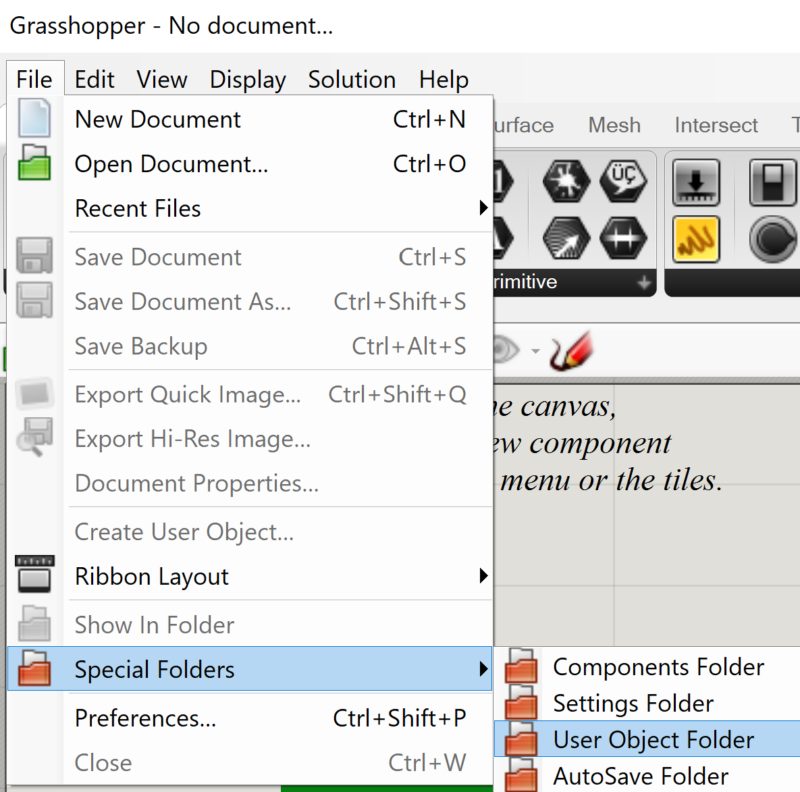
After unlocking and extracting the RequiredGHPlugins_SimAUD19.zip archive, copy the “SimAUD19 components” folder into the grasshopper component folder. The grasshopper component folder can be found at:

 C:\Users\YourUserName\AppData\Roaming\Grasshopper\Libraries

or via grasshopper file menu:

Install user objects

After unlocking and extracting the RequiredGHPlugins_SimAUD19.zip archive, copy the “SimAUD19 user objects” folder into the grasshopper UserObjects folder. The grasshopper component folder can be found at:

 C:\Users\YourUserName\AppData\Roaming\Grasshopper\UserObjects

or via grasshopper file menu:

Enable GPU acceleration

The requirement to run the GPU accelerated street network analysis is the CUDA platform enabled NVIDIA GPU.
If this requirement is fulfilled, you have to copy the folders “Alea.CUDA.CT.LibDevice” and “Alea.CUDA.CT.Native.X86.B64.Windows” from the GPU acceleration folder to your Rhino install folder (i.e. “Program Files\Rhinoceros 6 (64-bit)\System\”).

Discovering Cities Workshop | Amman

Discovering Cities Workshop | Amman

Hosted by: German Jordanian University, SABE (Amman, Jordan)
Funded by: DAAD

Locating and dimensioning spatial objects and with it the creation of spaces is at the heart of urban design. Thereby it is necessary to precast the effects that design decisions have on the behavior of the future users as well as to estimate the sustainability and resilience of the city. Computational analysis methods can help to support this process due to the fact that they can reveal properties that are hardly recognizable at first intuitive sight.

This workshop is a part of 10 days excursion in the city of Amman, Jordan. It will be the final stage of a seminar to learn and apply methods for the quantitative analysis of urban space (such as density, accessibility, visibility) and examine in how far these quantities relate to real life phenomena such as the spatial configuration of economical activities in a city or the movement patterns of urban users.

The seminar is part of an ongoing DAAD-funded project on discovering urban social and spatial patterns of Islamic cities and fostering exchange between German and Jordan academics in the field of urban planning.

Presentation

Workshop files

Jabal Al Hussain | model

Simplified street network and building footprints for Jabal Al Husain neighborhood.

Layers:

Palestinian refugee camp

  • Pedestrian street network
  • Car street network
  • Building footprints

Jordanian old district

  • Pedestrian street network
  • Car street network
  • Building footprints

Download Rhino file

Building coverage Density | script

Building coverage density is a measure of the relationship between built area (B) and area of the plan (A). It identifies how developed an area is along a scale of zero (no development) to one (the whole area is occupied by buildings).

This script measures the distribution of building coverage density through out the space and map the results on a grid. The plan area (A) in this script is defined as circular radius with flexible diameter parameter. The setting of the diameter influence if the density captures just close surrounding area of given location or larger neighborhood.


Download Grasshopper file

Street Network Centrality | script

Centrality measures for the street network in pedestrian radius of 600m and global car radius Rn. The analysis is calculated for Jordanian neighborhood alone and combined with the refugee camp

Centrality measures:

  • Closeness (integration) R600, Rn
  • Betweenness (choice) R600, Rn

Download Grasshopper file

Behaviour vs. Centrality | script

In this script you can link the empirical countings to the street network centrality and visualize the relationship between those two variables.The strong relationship suggest that the countings are influenced by the street network configuration. if not, they are independent.


Download Grasshopper file

eCAADe2018 Workshop | Urban Analysis, Synthesis and Exploration with Grasshopper

eCAADe2018 Workshop | Urban Analysis, Synthesis and Exploration with Grasshopper

DeCodingSpaces workshop on Urban Analysis, Synthesis and Design Exploration in Grasshopper hosted by: eCAADe2018, Poland – Łódź, 18.September 2018

In this workshop, you will learn how to generate urban fabric variants, perform quantitative analysis on it, as well as optimize the generated variants and expore the cooresponding solution space. For this purpose you will be introduced to various components from the DeCodingSpaces Toolbox for Rhino/GH. You will learn how to analyse Street Networks effectively to compute real life phenomena such as the distribution of functions in a city or the movement patterns of citizens. Moreover, you will be introduced to the various methods for the synthesis of urban morphology (street networks, plots, and buildings) and how they connect to the analysis methods. Finally, you will also be introduced to design space exploration tool for beeing able to compare the generated solution systematically. The presented DeCodingSpaces-Toolbox for Grasshopper is a collection of analytical and generative components for algorithmic architectural and urban planning. The toolbox is free software released by the Computational Planning Group (CPlan). It integrates established urban analysis methods, extends them with new features and introduces new methods for the analysis and synthesis of urban morphology. In the first part of the workshop, you will learn to use the street network analysis components and how the computed quantities relate to real life phenomena such as the distribution of functions in a city or the movement patterns of citizens. In the second part, we will implement a dynamic urban simulation in Grasshopper. For this purpose, we will use the results from the network analysis and compute local attractivity values for different urban functions like the population or workplaces, which interact with each other based on the corresponding distances. In the third part, we will demonstrate functions of the DeCodingSpaces-Toolbox for the synthesis of urban morphology (street networks, plots, and buildings), which is directly connected to the analysis and the simulation parts. In the last part, we use a Design-Space-Exploration tool (DSE) that presents the generated solutions in various ways.

Presentation
<iframe src="https://onedrive.live.com/embed?cid=C274443D8FC8835F&resid=C274443D8FC8835F%21247480&authkey=AKMlk2xrQcJQC0k&em=2" width="800" height="440" frameborder="0" scrolling="no"></iframe>
Workshop files

Part 1 – Analysis

Isovist

<iframe src="https://onedrive.live.com/embed?cid=C274443D8FC8835F&resid=C274443D8FC8835F%21247836&authkey=ADx2hkUcalVCm6c&em=2" width="800" height="460" frameborder="0" scrolling="no"></iframe>

01| 2D ISOVIST SINGLE POINT

Analysis 2d, 3d Isovist


Download Grasshopper file

04| 2D ISOVIST OBJECT VISIBILITY

Analysis 2d, 3d Isovist


Download Grasshopper file

02| 2D ISOVIST PATH

Analysis 2d, 3d Isovist


Download Grasshopper file

05| 3D ISOVIST

Analysis 2d, 3d Isovist


Download Grasshopper file

03| 2D ISOVIST FIELD

Analysis 2d, 3d Isovist


Download Grasshopper file

Street Network Analysis

01| CITY GRAPH STARTING EXAMPLE

Street Network Analysis


Download Grasshopper file

04| CITY GRAPH ONE WAY ROADS

Street Network Analysis


Download Grasshopper file

02| PARK EDGE WEIGHTING

Street Network Analysis


Download Grasshopper file

05| CITY GRAPH CENTRALITY VERTEX WEIGHTING

Street Network Analysis


Download Grasshopper file

03| CITY GRAPH BUS EDGE WEIGHTING

Utilities

01| NETWORK EDITING TOOLS

02| ANALYSIS GRID

03| CUSTOM OFFSET

Part 2 – Generation

<iframe src="https://onedrive.live.com/embed?cid=C274443D8FC8835F&resid=C274443D8FC8835F%21247834&authkey=AMysWlAm22Zf6x8&em=2" width="800" height="460" frameborder="0" scrolling="no"></iframe>

01| STREET NETWORK FROM GUIDE LINE

02| STREET NETWORK FROM GRID

03| STREET NETWORK SYNTHESIS

Part 3 – Exploration

<iframe src="https://onedrive.live.com/embed?cid=C274443D8FC8835F&resid=C274443D8FC8835F%21247833&authkey=AJxEsDfWKclD3Gk&em=2" width="800" height="460" frameborder="0" scrolling="no"></iframe>

01| DESIGN SPACE EXPLORATION

Part 4 – Hands On, Generate Analyze & Explore

<iframe src="https://onedrive.live.com/embed?cid=C274443D8FC8835F&resid=C274443D8FC8835F%21247689&authkey=AEgk0zw0HI9JXqo&em=2" width="800" height="460" frameborder="0" scrolling="no"></iframe>

Weimar Urban Layout Generator

Impressions of the Workshop Results

http://infar-vm.architektur.uni-weimar.de/dse2/dse
The session ID is: YKIKFUCBTEGlqI6g

Cognitive Urban Design Computing @ FCL

Cognitive Urban Design Computing @ FCL

This post documents our research in the Cognitive Design Computing (CoDeC) workstream of the Big Data Informed Urban Design and Governance project at the Future Cities Lab in Singapore with status July 2018. It is structured in our research on generation, analysis, and exploration methods. We demonstrate our methods in the context of the synergy project Waterfront Tanjong Pagar in Singapore. In this context we used partially inputs from other FCL research groups. The idea of Cognitive Urban Design Computing is to combine unique human design competences with computational methods for the generation, analysis, and exploration of urban designs. The loop of analysis and generation methods is the basis for automated spatial synthesis. Design space exploration methods are used for the presentation and selection of synthesized design variants.

Research Team: Katja Knecht, Yufan Miao, Kateryna Konieva, Pol Foreman, Reinhard Koenig (contact author), Gerhard Schmitt, in collaboration with Dietmar Leyk.

Introduction

The image illustrates the framework for Cognitive Urban Design Computing.

Overview of the spatial synthesis process for Waterfront Tanjong Pagar

Generation and Analysis

Kateryna Konieva

We use the Waterfront Tanjong Pagar area for demonstrating the automated loop of generation and analysis of urban design variants. The video below shows the parametric design workflow with various analysis methods integrated in the spatial synthesis process. Currently we use network analysis, economic potentials, view analysis, as well as solar and shadow analysis.

Optimization

Yufan Miao

For the automatization of the spatial synthesis process, we use evolutionary multi-criteria optimization algorithms. Therefore we needed to develop an appropriate data structure to represent spatial configurations (streets, parcels, and buildings), which allows the application of evolutionary operators (crossover, mutation, and adaption).

Design Space Exploration

Katja Knecht

The spatial synthesis process we presented allows to generate a large number of urban design variants. To present these variants in a meaningful way to urban planners or stakeholders, we explore the usage of design space exploration tools and new interface concepts. The aim is to provide a platform to discuss, compare and evaluate variants based on analysis results in order to allow stakeholders to take informed design decisions.

Comparison of design alternatives using the beta.speckle online interface.

The following video shows how design variants can be filtered according to specified design and performance characteristics in the Design Explorer application:


How design alternatives can be assessed and evaluated in the Speckle online viewer, e.g. by comparing analysis results such as shading and sunlight hours analysis, can be seen in the following clip:

Building Typologies

Pol Foreman

In collaboration with the FCL synergy project Waterfront Tanjong Pagar led by Dietmar Leyk, we developed a parametric urban masterplan, which allows the generation of adequately detailed urban block typologies and buildings.

Presentation

Big Data Informed Urban Design and Governance

The Cognitive Design Computing (CoDeC) workstream is part of the Big Data Informed Urban Design and Governance project at the Future Cities Lab in Singapore. The video below gives an overview of all workstreams of the project and how they are related to each other.

Acknowledgement This research was conducted at the Future Cities Laboratory at the Singapore- ETH Centre, which was established cooperatively between ETH Zurich and Singapore’s National Research Foundation (FI 370074016) under its Campus for Research Excellence and Technological Enterprise programme (CREATE).

Related Publications

Sorry, but the selected Zotpress account can't be found.

Please enter a password to see the content.


Wrong password, please try again
Workshop | Network analysis based dynamic urban simulation in Grasshopper

Workshop | Network analysis based dynamic urban simulation in Grasshopper

DeCodingSpaces workshop on network analysis based dynamic urban simulation in Grasshopper hosted by: SimAUD 2018, Netherlands, TU Delft, 04.Jun 2018

After a general introduction to spatial analysis methods, you learn in this workshop how to use components from the DeCodingSpaces-Toolkit in Rhino/GH for the quantitative analysis of urban space. Based on these analyses we implement a basic urban development simulation for a case study city. The presented DeCodingSpaces-Toolbox for Grasshopper is a collection of analytical and generative components for algorithmic architectural and urban planning. The toolbox is free software released by the Computational Planning Group (CPlan). It integrates established urban analysis methods, extend them with new features and introduces new methods for the analysis and synthesis of urban morphology.

Presentation
Workshop files
Part 1

01| 2D ISOVIST SINGLE POINT

Analysis 2d, 3d Isovist


Download Grasshopper file

03| 2D ISOVIST FIELD

Analysis 2d, 3d Isovist


Download Grasshopper file

05| 3D ISOVIST

Analysis 2d, 3d Isovist


Download Grasshopper file

02| 2D ISOVIST PATH

Analysis 2d, 3d Isovist


Download Grasshopper file

04| 2D ISOVIST OBJECT VISIBILITY

Analysis 2d, 3d Isovist


Download Grasshopper file

Part 2

01| CITY GRAPH STARTING EXAMPLE

Analysis Street Network


Download Grasshopper file

03| CITY GRAPH BUS EDGE WEIGHTING

02| PARK EDGE WEIGHTING

Analysis Street Network


Download Grasshopper file

04| CITY GRAPH ONE WAY ROADS

Analysis Street Network


Download Grasshopper file

04| CITY GRAPH CENTRALITY VERTEX WEIGHTING

Analysis Street Network


Download Grasshopper file

Part 3

01| NETWORK EDITING TOOLS

03| CUSTOM OFFSET

02| ANALYSIS GRID

Part 4

01| DYNAMIC URBAN DEVELOPMENT MODEL

02| More Information

Please find more detailed information in the related paper on Urban Simulation with Grasshopper for Rhino3D.


Public Transport Isochronal Map

Public Transport Isochronal Map

This page shows a technical demonstration of a tool for visualizing pulbic transport access times as an isochronic map. The tool was developed in the Smart Spatial Planning Systems group at the Austrian Institute of Technology (AIT). The tool is implemented as Grasshopper definition and can be controlled with a simplified user interface from Rhino3D.

The tool makes use of Grasshopper extension Spiderweb 4.2 by Richard Schaffranek.

Research Team: Ondřej Veselý, Reinhard Koenig

The module makes use of existing data on public transport routes, which is openly available from Wiener Linien. However user can easily modify the dataset using CAD-like interface to explore new scenarios, such as construction of additional routes and more frequent or faster connections.

The resulting access time can be mapped to all buildings or streets, or displayed as isochronic curves – an isochrone of time t is the surface at equal time distance from the starting points.


The files used in this example are included for internal use by our research partners in protected archive below.

Please enter a password to see the content.


Wrong password, please try again

Pin It on Pinterest