Computational Urban Design Prototyping

Computational Urban Design Prototyping

The presented study is made for Cape Town city in South Africa, in which approximately 7.5 million people living in informal settlements and about 2.5 million housing units are needed. This motivates us to develop upgrading strategies for informal settlements. For this purpose, we developed an adaptive and interactive tool for rapid computational urban design prototyping. The tool can be used to generate urban layouts including street networks, blocks, parcels and buildings based on requirements specified by an urban designer. For implementing  the layout generation process, we developed an underlying tree data structure to represent street networks and parcellings. Moreover, network analysis methods were applied for controlling the distribution of buildings in the communities so that preferred neighborhood relationships are considered. Finally we demonstrated how to compare designs based on spatial analysis.

Research Team: Reinhard Koenig (contact author), Peter Bus, Yufan Miao, Chang-Mei Chih, Artem Chirkin.
The presented research evolves within the context of a collaboration with Scott Lloyd from the Urban Think Tank (U-TT) at ETH Zurich.

Acknowledgement

This page contains accompanying material for the paper Computational Urban Design Prototyping: Interactive Planning Synthesis Methods Demonstrated by a Case Study in Cape Town, published in the International Journal of Architectural Computing (IJAC), [it’s currently under review].

The Computational Urban Design Process

We implemented a new data structure for a slicing tree. The slicing (A) starts from one edge (1). After that, it slices the edge (2) on the left side of the slicing line (B) and next the one on the right (C, 4). A slicing line is stored in the slicing tree by assigning it to the edge it crosses. At the same time, the slicing lines are ranked based on their levels in the tree structure.

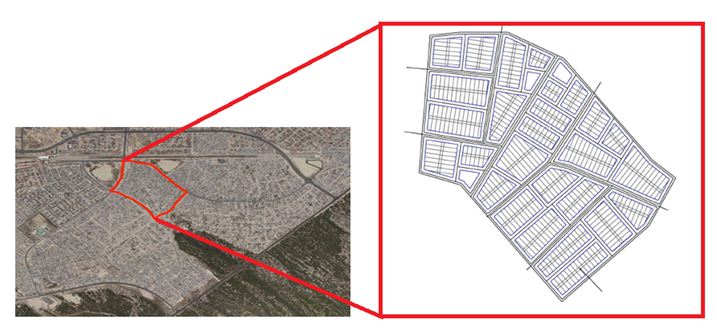
The case study area is Enkanini in Cape Town City, South Africa, for which we generate urban planning variants in a fast and interactive way.

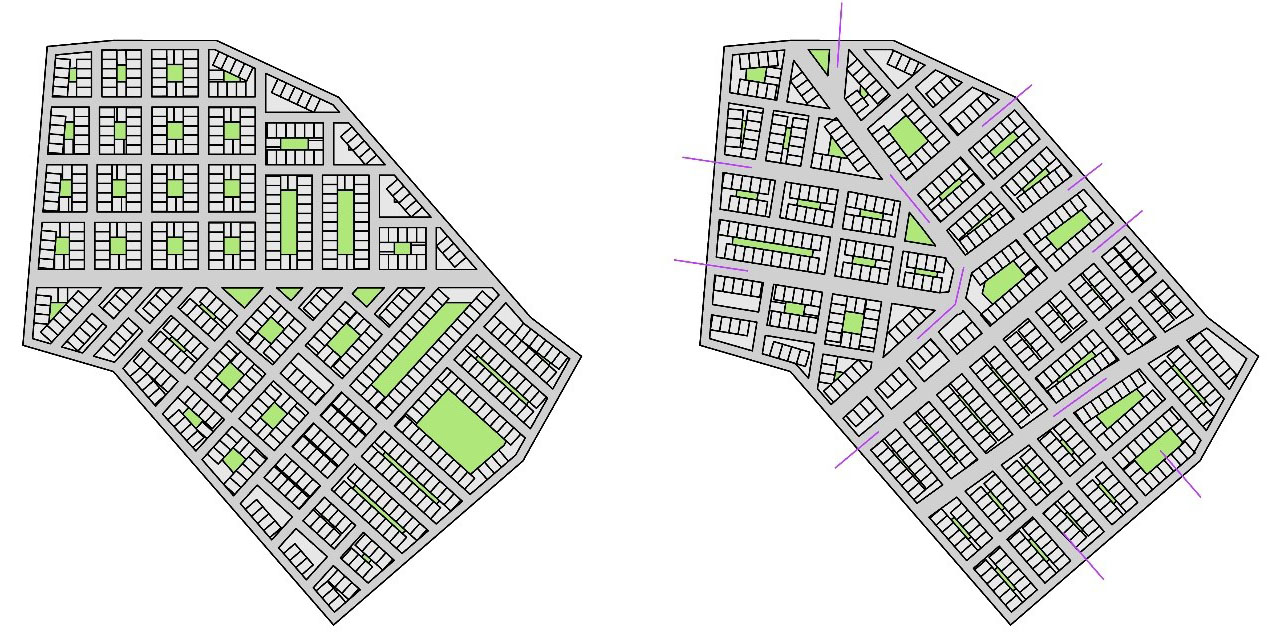
Example of two urban layouts for the sliced parcels, generated freely (left) and using initial street segments to guide street network generation (right).

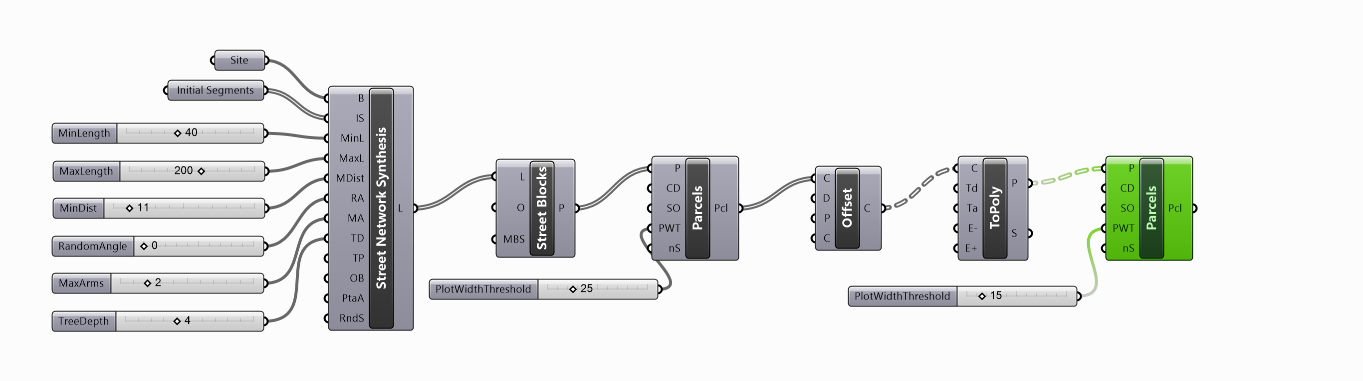
To increase the precision for generating parcels with a defined width, we nested the block and parcel generation.

Using the Speckle plug-in for Grasshopper the generated urban layouts can be made accessible online to share and communicate the design as well as to allow stakeholders to explore design alternatives. In accordance with the initial specifications, the interface allows to change the dimensions of the parcels within a defined parameter range using sliders to adjust the parcels width and depth.

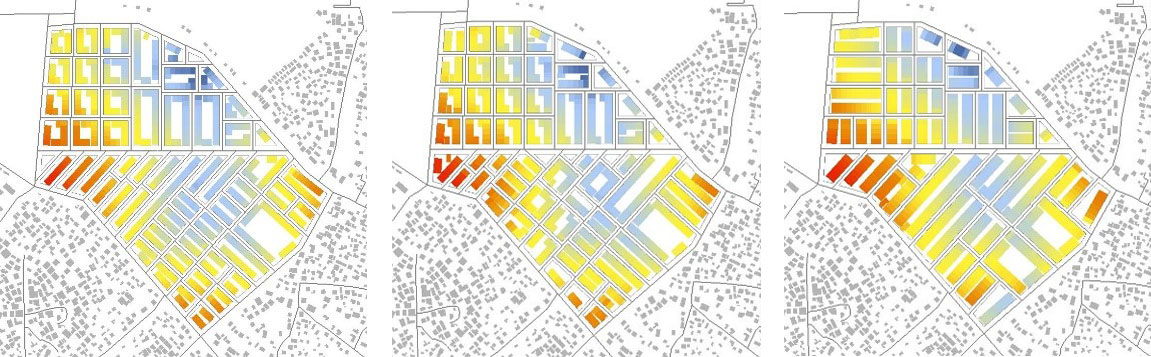
The generated urban layouts can be analysed with various methods. In this example we assessed pedestrian accessibility of the educational and commercial facilities by using a gravity-based method.

Video of the Computational Urban Design Process

Related Publications

Sorry, but the selected Zotpress account can't be found.

Download Grasshopper Definitions

Requirements

The Grasshopper files are created for Grasshopper (build 0.9.0076) with Rhino3D v.5. To open and run the models you need to install the DeCodingSpaces-Toolbox (we used version 2018.01) – food4rhino is not always working.

Download Adaptive EmpowerShack Grasshopper Definition

Dynamic Urban Development Model

Dynamic Urban Development Model

With this model we demonstrate the combination of the DeCodingSpaces synthesis and analysis components in order to link them with a basic urban dynamics simulation. The definition creates a synthetic settlement and simulates the distribution of population and workplaces over time. The results from this simulation control the development of the individual blocks including the generation of pacelling patterns and the placing of buildings of various typologies.
The model was first introduced at the seminar “Applied System Dynamics for Urban Modeling and Simulation” of the Professorship for Computational Architecture at the Bauhaus-University Weimar, 2018. It is based on the models described in the article Urban Simulation with Grasshopper for Rhino3D.

Research Team: Reinhard Koenig (contact author), Martin Bielik, and Sven Schneider

Requirements

The Grasshopper files are created for Grasshopper (build 0.9.0076) with Rhino3D v.5. To open and run the models you need to instal the Anemone plugin (we used version 0.4), and the DeCodingSpaces-Toolbox (you need the version from 24.04.2018 or later).

Download

Grasshopper Definition Dynamic Urban Model

You may find updated versions of the script on the course website Urban Modeling and Simulation.

The animation shows how the simulation results are used as basis for the development of individual blocks.


The video demonstrates step by step the combination of the DeCodingSpaces synthesis and analysis components with the urban development simulation.
Grasshopper snippets for Urban Design and Analysis

Grasshopper snippets for Urban Design and Analysis

The chairs of Computer Science in Architecture and Computational Architecture at the Bauhaus-University Weimar have developed a few Grasshopper snippets for the course Computational Urban Analysis. To make them accessible to a wider audience, we share them on this blogpost. There are additional scripts provided in the Parametric Planning Catalogue :: https://infar-buw.github.io/parametric-planning-catalogue/

Divide by Area

Implementation of Sumit Kheterapal’s equal plot division algorithm with improvments in choosing preferred direction of divisions and setting of individual areas.

Area Blobs

Regions grow in circular, squared or rhombus-like directions until they reach their demanded area. This component makes use of Alpha Shape by Mateusz Zwierzycki which is part of Milkbox.

Automatic Pipe Dimensioning

EPANET hydrology analysis combined with Anemone by Mateusz Zwierzycki  to automatically dimension pipes.

Visual Distance

Calculate a smallest number of turns neccesary to reach any area from a set of given start points. This snippet makes use of SpiderWeb 4.2 by Richard Schaffranek.

Easy Plots

Curves drawn on a layer are directly segmented. Closed segments are turned into areas with an offset and coloured according to their size.

Distance to all buildings

The distance from each building to all other building is calculated. Grayscale colours show which ones have the shortest and longest ways. Furtheron the streets are coloured by their Betweenness Centrality.

Path by Steepness

A path is calculated by the steepness of the terrain. The angle can be adjusted to get flat or steep paths. This snippet makes use of SpiderWeb by Richard Schaffranek.

Weighted boundary

A boundary is created around a point with a given area. The influence of terrain and road can be weighte and lead to different results. This component makes use of Alpha Shape by Mateusz Zwierzycki which is part of Milkbox. The script is inspired by work of Ondřej Veselý.

Includes further on a definition to expand streets by weight.

Fill polygons by area

An adapted version of the weighted boundary script, which adds two more boundaries to the Grasshopper definition and keeps all of them inside of given polygon shapes.

Kangaroo bubble diagram

Bubbles with given area can be repositioned and keep each other out of bounds. This component makes use of Kanagaroo Physics by Daniel Piker.

Redistribution

A script which redistributes quantities to other points by given percentage.

Urban Simulation with Grasshopper for Rhino3D

Urban Simulation with Grasshopper for Rhino3D

Dynamic urban development simulation models are usually separate to urban planning tools making it difficult to test the consequences of urban planning variants directly without switching between expert tools. This paper presents an approach to integrating system dynamics simulation at various scales and abstractions in the visual programming environment Grasshopper for Rhino3D. We demonstrate how Grasshopper may be used with additional customized components as a flexible integrated urban planning and simulation framework. For this purpose, we present three urban planning model examples: The first is a classical system dynamics simulation that abstracts from spatial elements. The second adds spatial relations in terms of distances between locations in a grid. The third shows how to represent a city in more details and adds a network analysis module for more precise distance calculations. As result, we demonstrate a highly flexible approach for integrating simulations for various aspects that predict the behavior of an urban system in order to facilitate more sustainable urban planning processes. The main drawback of this new level of flexibility is the relatively slow execution time for complex simulations.

Research Team: Reinhard Koenig (contact author), Martin Bielik, and Sven Schneider

Requirements

The Grasshopper files are created for Grasshopper (build 0.9.0076) with Rhino3D v.5. To open and run the models you need to instal the Anemone plugin (we used version 0.4), and for the models 3 and 4 the DeCodingSpaces-Toolbox (we used version 2018.01). Download all four Grasshopper models.

Acknowledgement

This page contains accompanying material for the SimAUD 2018 conferece paper System Dynamics for Modeling Metabolism Mechanisms for Urban Planning.

Presentation at SimAUD conference, TU Delft, 7th of June 2018

<iframe src="https://onedrive.live.com/embed?cid=A9C91ACB2B66CA2A&resid=A9C91ACB2B66CA2A%218837&authkey=AI9F1cDQwTGBJNg&em=2&wdAr=1.3333333333333333" width='800px' height='620px' frameborder="0">Dies ist ein eingebettetes <a target="_blank" href="https://office.com">Microsoft Office</a>-Dokument, unterstützt von <a target="_blank" href="https://office.com/webapps">Office Online</a>.</iframe>

1. Wolf-Sheep-Predation Test Model

In the first model, we reproduced the wolf-sheep-predation system dynamics model from the NetLogo model library in Grasshopper.

Download Grasshopper Model


2. Abstract urban dynamics model

The second model implemented an abstract urban dynamic system that includes the development of population size, number of jobs and food production (stocks). These stocks depend on various relationships between each other (flows) and on the available areas for the corresponding land uses.

Download Grasshopper Model


3. Grid-city model

The third model uses a 12 × 8 = 96 cells grid. Based on the all-pair Manhattan distances between the cells, we compute for each iteration the attractivity of a cell for new population or workplaces.

Download Grasshopper Model

4. Net-city model

For the fourth model we use the real geometry of a city and compute the distances between locations by means of shortest paths in the street network. For this demonstration, we used the central part of the city of Weimar in Germany.

Download Grasshopper Model

For learning more about the implementation of the Net-City model, please look at the post on our SimAUD Workshop Network analysis based dynamic urban simulation in Grasshopper.

The last model is further extended. Please look at the article Dynamic Urban Development Model.

Related Publications

Sorry, but the selected Zotpress account can't be found.

Presentation at IWCEE18 – VI International Workshop on Computational Economics and Econometrics, Rome, June 27th 2018

Session: Transitions towards sustainable and resilient cities: analytic and modelling approaches

<iframe src="https://onedrive.live.com/embed?cid=A9C91ACB2B66CA2A&resid=A9C91ACB2B66CA2A%218935&authkey=AHlT2twGSe07RPo&em=2&wdAr=1.7777777777777777" width='800px' height='472px' frameborder="0">This is an embedded <a target="_blank" href="https://office.com">Microsoft Office</a> presentation, powered by <a target="_blank" href="https://office.com/webapps">Office Online</a>.</iframe>

Pin It on Pinterest