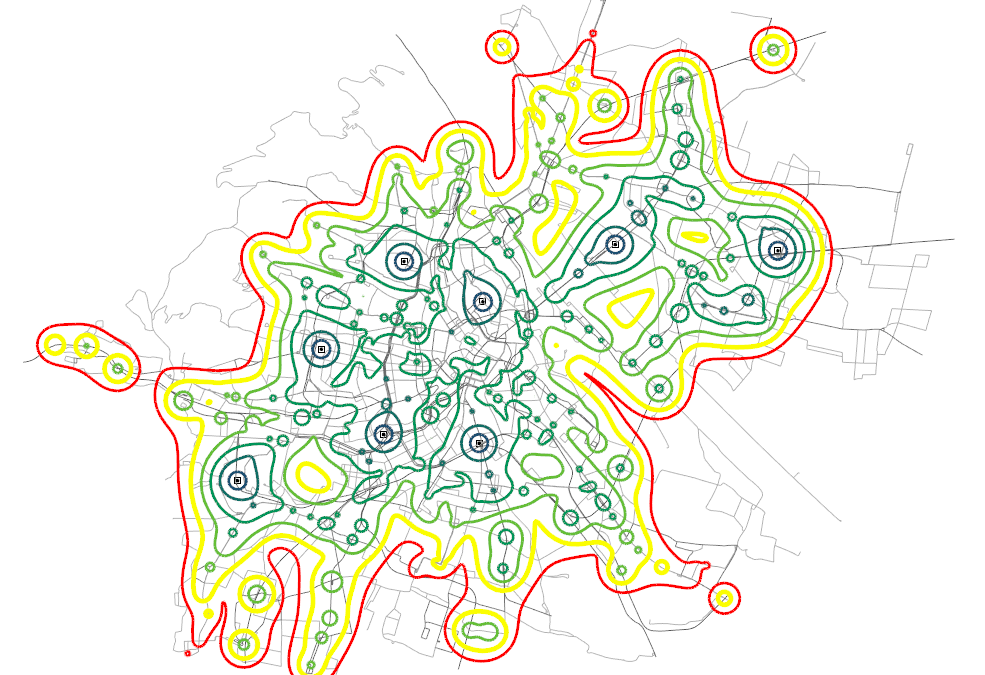
This page shows a technical demonstration of a tool for visualizing pulbic transport access times as an isochronic map. The tool was developed in the Smart Spatial Planning Systems group at the Austrian Institute of Technology (AIT). The tool is implemented as Grasshopper definition and can be controlled with a simplified user interface from Rhino3D.
The tool makes use of Grasshopper extension Spiderweb 4.2 by Richard Schaffranek.
Research Team: Ondřej Veselý, Reinhard Koenig

The module makes use of existing data on public transport routes, which is openly available from Wiener Linien. However user can easily modify the dataset using CAD-like interface to explore new scenarios, such as construction of additional routes and more frequent or faster connections.
The resulting access time can be mapped to all buildings or streets, or displayed as isochronic curves – an isochrone of time t is the surface at equal time distance from the starting points.
The files used in this example are included for internal use by our research partners in protected archive below.
Please tell me how to instal this software in laptop and want to work with then.
It’s not a stand-alone software. We use a custom definition in Grasshopper for Rhino3D.
Hello!
Is it possible to have the RH/GH sample files?
Best regards
Shahrokh
Unfortunately not, because we created it with a partner who do not agree on sharing the files.
Best regards
Reinhard